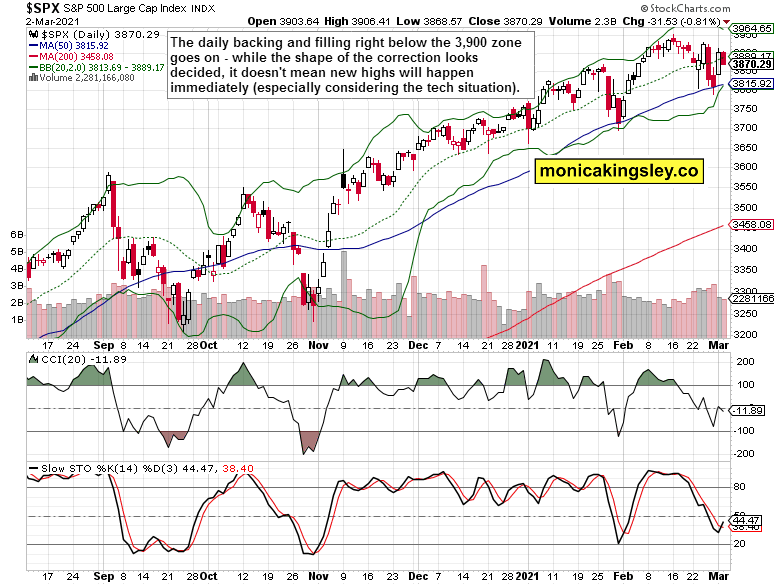
Stocks gave up some of Monday‘s strong gains, but I find it little concerning in the sub-3,900 pre-breakout meandering. It‘s about time, and a play on the tech sector to participate meaningfully in the coming rally (or at least not to stand in the way again).
Talking obstacles, what about today's non-farm employment change, before the really key release on Friday? A bad number makes it less likely for market participants to bet on the Fed raising rates soon. But frankly, I don't understand where this hawkish sentiment is coming from, now when we're not at even talking taper. Raising rates in the current shape of the recovery, where we have commodities and financial asset prices rising, and that‘s about it?
No, the current economic recovery isn't strong enough to entertain that thought. The need for stimulus as soon as possible is obvious. Thus, prior trends in the commodities and currency arenas are likely to continue, and not even the current long-term Treasuries stabilization can prevent the greenback from falling more than temporarily.
Just as I wrote yesterday about stocks:
(…) All right, we're seeing a rebound in progress, on the way to new highs.
Gold scored modest gains yesterday, but these aren‘t enough to flip its short-term outlook bullish. Yes, it's sitting within the strong support zone (with another one over $40 further lower), and it isn't breaking down. It could actually stage a rebound precisely off this support zone next, as sharp rallies are born during the opposite sentiment clearly prevailing, which is what we have in gold now.
Silver remains relatively solid, and commodities aren't breaking down. We have a month historically strong for copper, and I talked both yesterday and Monday what that means for the copper to oil ratio – and its relationship to gold, given the very accommodative monetary policy without real end in sight. This is then checked against nominal rates matching up against inflation, inflation expectations.
Let‘s move right into the charts (all courtesy of www.stockcharts.com).
S&P 500 Outlook And Its Internals

Yesterday's downswing didn't attract much volume, making it a short-term hesitation That's the meandering, the search for direction just below the 3,900 mark that I had been tweeting about yesterday. If you look at the equal weighted S&P 500 chart (RSP ETF), it's clear that new highs are still a little off given the sectoral balance of power.

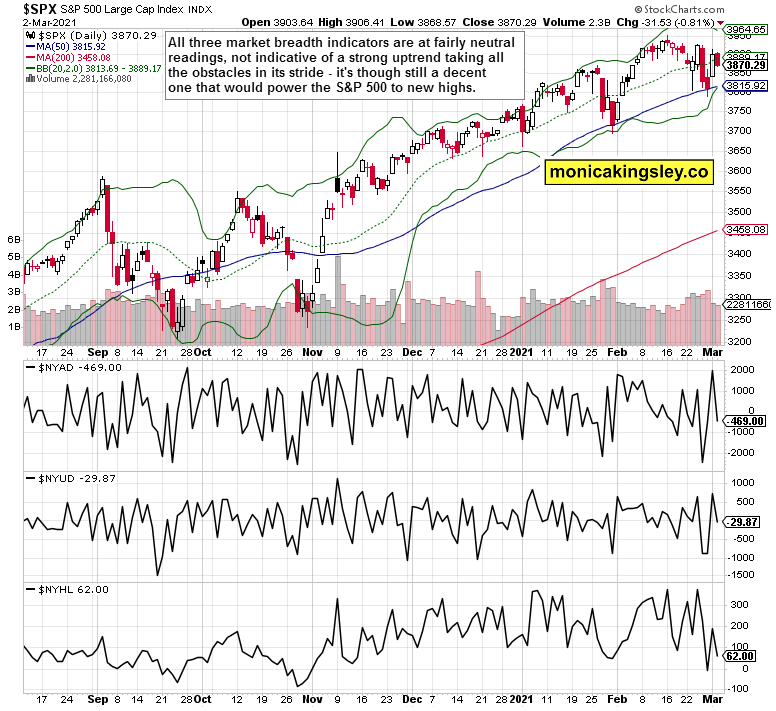
The market breadth indicators reflect the daily indecisiveness fittingly. While not worrying in themselves, they‘re showing that Monday's session wasn't the beginning of an endless bullish streak. Rather, it's just a part of the bullish turn that would over time prevail more convincingly.
Credit Markets

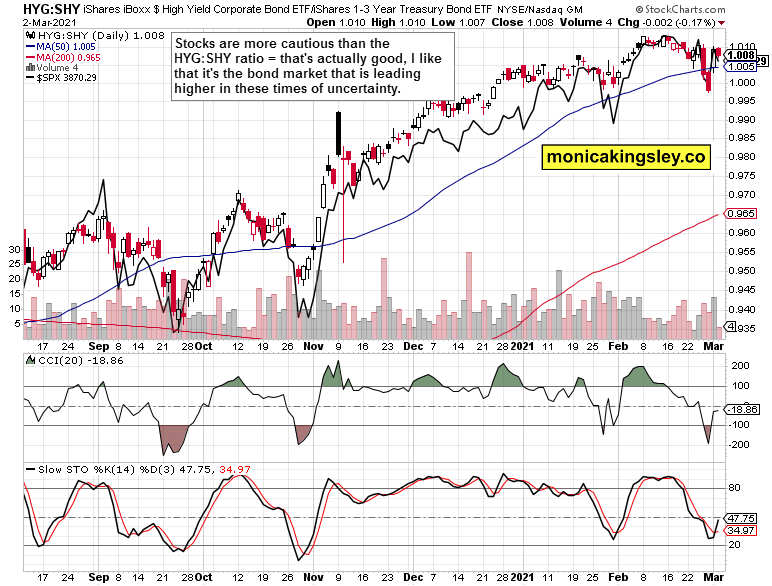
The key leading credit market ratio – high-yield corporate bonds to short-dated Treasuries (HYG:SHY) – is slightly leaning bullish here. And that's good given the talk of bubble bursting, significant correction just ahead (started) – that's what I am looking for in uncertain times. Ideally though, such a bond market leadership should last a bit longer than one day, to lend it more credibility.
Technology

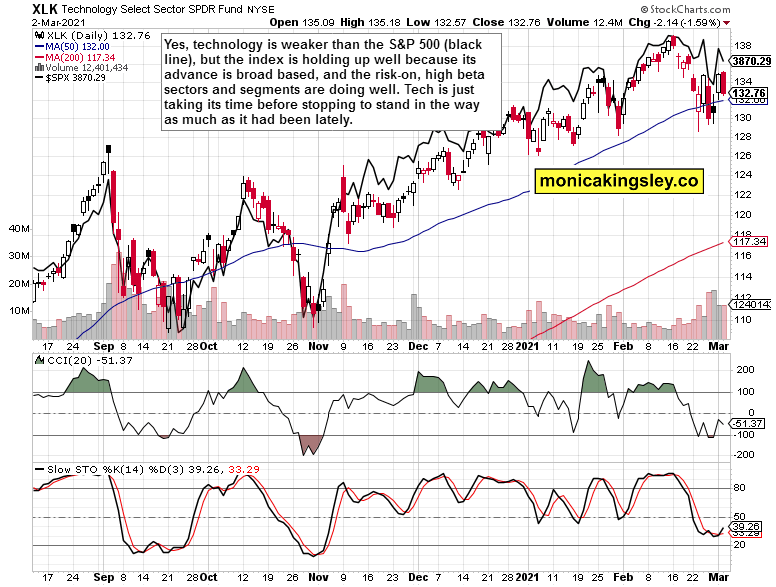
Technology (Technology Select Sector SPDR® Fund (NYSE:XLK) ETF) once again reversed to the downside, or so the chart says. While high, the volume isn't trustworthy – it doesn't stand comparison to the visually similar early September pattern, which was followed by a break to new lows in the latter half of the month. Then, as the overlaid S&P 500 (black line) shows, high beta pockets and value sectors have assumed leadership, powering the S&P 500 advance.
Summary
Stock bulls are on a recovery path, and new all-time highs are basically a question of when tech would step up to the plate again. Despite today's premarket weakness reaching well below the 3,870 level, the S&P 500 internals and credit markets performance (including foreign bonds) doesn't indicate that there is much downside potential currently. This correction's shape is largely in. Patience, though, will be needed before seeing new highs.
