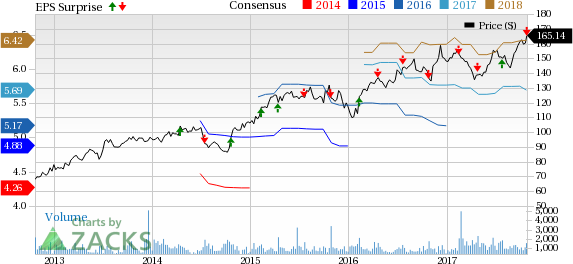
Watsco, Inc. (NYSE:WSO) reported record earnings per share of $1.82 in third-quarter 2017, up 2% year over year. Earnings, however, missed the Zacks Consensus Estimate of $1.94.
Results reflect disruptions from Hurricanes — Harvey, Irma and Maria — which impacted certain of the company’s largest markets, during August and September. Regions including Florida, Texas, Georgia and Puerto Rico, which represent around 35% of Watsco’s sales, were severely damaged. The estimated earnings per share impact came in at approximately 10 cents per share in the reported quarter.
Furthermore, export activities to the Caribbean basin and markets in central Mexico following the Mexico City earthquake also experienced disruption. Nevertheless, continued investment in a variety of technologies and products partly offset the negative impact of the above-mentioned natural disasters.
Total revenues in the quarter edged down 1% year over year to $1.23 billion. The revenue figure also missed the Zacks Consensus Estimate of $1.25 billion. Sales of HVAC (heating, ventilating and air conditioning) remained flat, while both commercial refrigeration products and other HVAC products sales dropped 4%.
Cost and Margins
Cost of sales inched up 0.6% to $933.7 million from $939 million recorded in the year-ago quarter. Gross profit dipped 2.1% year over year to $295.9 million. Gross profit margin contracted 20 basis points (bps) year over year to 24.1%.
Selling, general and administrative expenses edged up 0.5% year over year to $183.7 million. Operating income decreased 4% year over year to $114.5 million. Operating margin was down 30 bps from the prior-year quarter to 9.3%.
Financial Operations
Watsco had cash and cash equivalents of $66.7 million as of Sep 30, 2017, compared with $56 million recorded at the end of 2016. The company delivered $184.7 million of operating cash flow during the nine-month period ended Sep 30, 2017, compared with $146.3 million witnessed in the comparable period last year.
In June 2017, Watsco’s Carrier Enterprise business unit acquired 35% ownership of Russell Sigler, Inc. The move is in sync with Watsco’s concerted efforts to collaborate with well-established businesses and will strengthen the company’s presence in significant Western U.S. markets. The third-quarter results also include 5 cents per share attributable to the company’s ownership interest in Russell Sigler.
Acquisition of Joint-Venture Interests
In February 2017, Watsco raised its ownership of Carrier Enterprise Northeast LLC, a joint venture with Carrier, to 80% from 70% for approximately $43 million in cash. Carrier Enterprise Northeast had sales of approximately $500 million in 2016 from 41 locations in the Northeastern United States and 12 locations in Mexico. Watsco’s nine-month results include a contribution of 12 cents per share from the increased ownership interest.
Outlook
Watsco projects continued record performance in 2017 with full-year earnings per share in the range of $5.50-$5.60 per share. The company continues to make progress with its industry-leading technologies and estimates the e-commerce sales to touch $1 billion this year.
Our View
Watsco continues to transform its business into the digital age by investing in scalable platforms for mobile apps, e-commerce, business intelligence and supply chain optimization. Moreover, Watsco continues to actively seek acquisitions, and investments to grow its network and leverage investments.
Share Price Performance
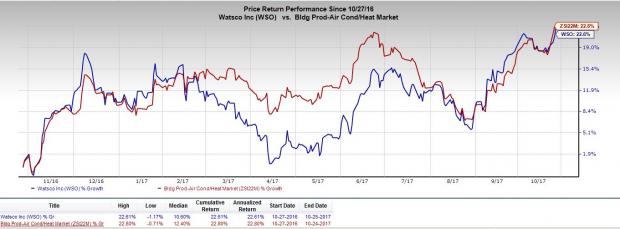
In the last year, Watsco has underperformed its industry with respect to price performance. The stock has gained around 22.6%, while the industry recorded growth of 22.8% during the same time frame.

Zacks Rank & Key Picks
Currently, Watsco carries a Zacks Rank #3 (Hold).
Better-ranked stocks in the same space include Potlatch Corporation (NASDAQ:PCH) , NVR, Inc. (NYSE:NVR) and United Rentals, Inc. (NYSE:URI) , all three sporting a Zacks Rank of 1 (Strong Buy). You can see the complete list of today’s Zacks #1 Rank stocks here.
Potlatch Corporation has an expected long-term growth rate of 5%.
NVR, Inc. has an expected long-term growth rate of 14.9%.
United Rentals has an expected long-term growth rate of 15.6%.
Looking for Stocks with Skyrocketing Upside?
Zacks has just released a Special Report on the booming investment opportunities of legal marijuana.
Ignited by new referendums and legislation, this industry is expected to blast from an already robust $6.7 billion to $20.2 billion in 2021. Early investors stand to make a killing, but you have to be ready to act and know just where to look.
See the pot trades we're targeting>>
United Rentals, Inc. (URI): Free Stock Analysis Report
Watsco, Inc. (WSO): Free Stock Analysis Report
Potlatch Corporation (PCH): Free Stock Analysis Report
NVR, Inc. (NVR): Free Stock Analysis Report
Original post
Zacks Investment Research

