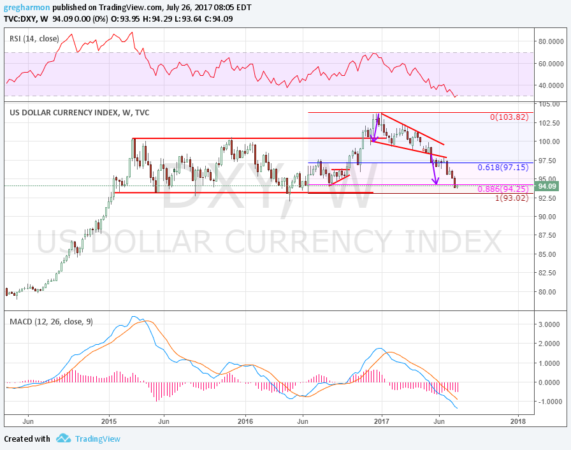
It is all but forgotten that this time 3 years ago the US Dollar Index rose from a base at 80 up to near 100 at the end of 2014. Maybe that is because it stayed in a tight range for 2 years after that. Maybe because of all the craziness that has happened in the world since then. Whatever reason, we have moved on to the present.
And here that tight range looks more like a move in two strong trends, first to the upside and then to the downside. The Index printed a Hammer reversal candle in May 2016. As it confirmed the reversal it rose through the 2 year range and then stalled at a new high near 104 at the end of 2016. Since then it has been heading lower.
It started in a falling wedge and then broke that wedge to the downside in May. The target on the move lower was to about 94.20 and it reached that last week. It also reached an 88.6% retracement of the uptrend. And so far this week it is holding with a small body candle and trying to move higher. Is a reversal brewing?

Aside from reaching the price targets where traders would start to close shorts, momentum is also reaching important levels. The RSI is moving into oversold territory, and levels it has not seen for 6 years. The MACD is also at its 2011 low extreme level.
Both can always go lower or just stay there, but the combination of price patterns and indicators suggest it would be a good time for a reversal. As always, wait for confirmation before acting. In this case it would be a small body or Hammer candle this week and a higher close next week.
DISCLAIMER: The information in this blog post represents my own opinions and does not contain a recommendation for any particular security or investment. I or my affiliates may hold positions or other interests in securities mentioned in the Blog, please see my Disclaimer page for my full disclaimer.
