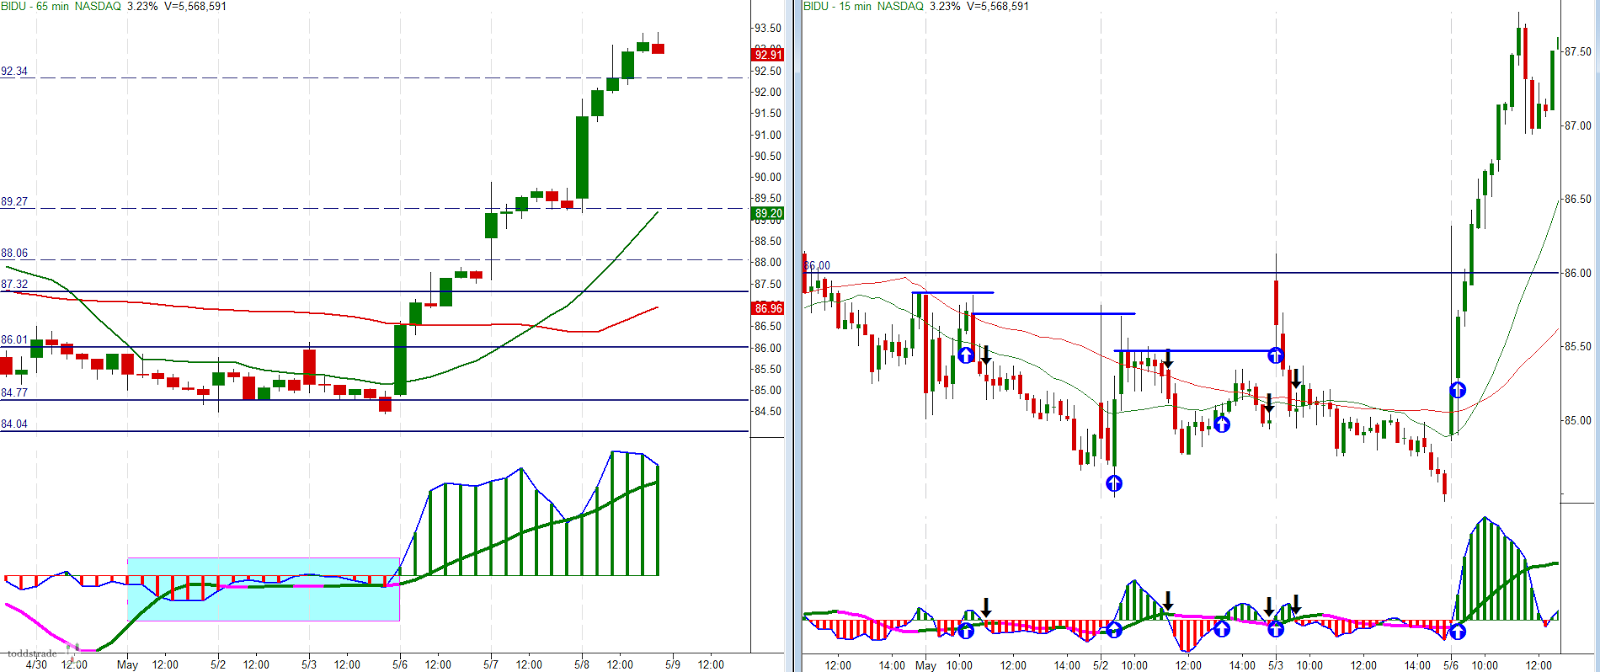
I've been watching BIDU here and there, watching for the higher time frame 3d criteria setup to develop on the higher time frame (shaded area in the chart below, left).
I thought this would be a good example to profile because of the difficulty which the "triggers" proved to be. The important consideration for this setup to exhibit is strength in price recovering a significant market structure high (look left for pivots).
The Blue up-arrows (on the 15-min chart below, right) are potential long entry "triggers". The black down arrows are instances where the fast line and slow line cross, which should be an "at most" stop out metric. The blue trendlines and horizontal line at $86 indicate significant pivots for price to take out, so when you see an up arrow, look to the left and see which pivot that price needed to close above.
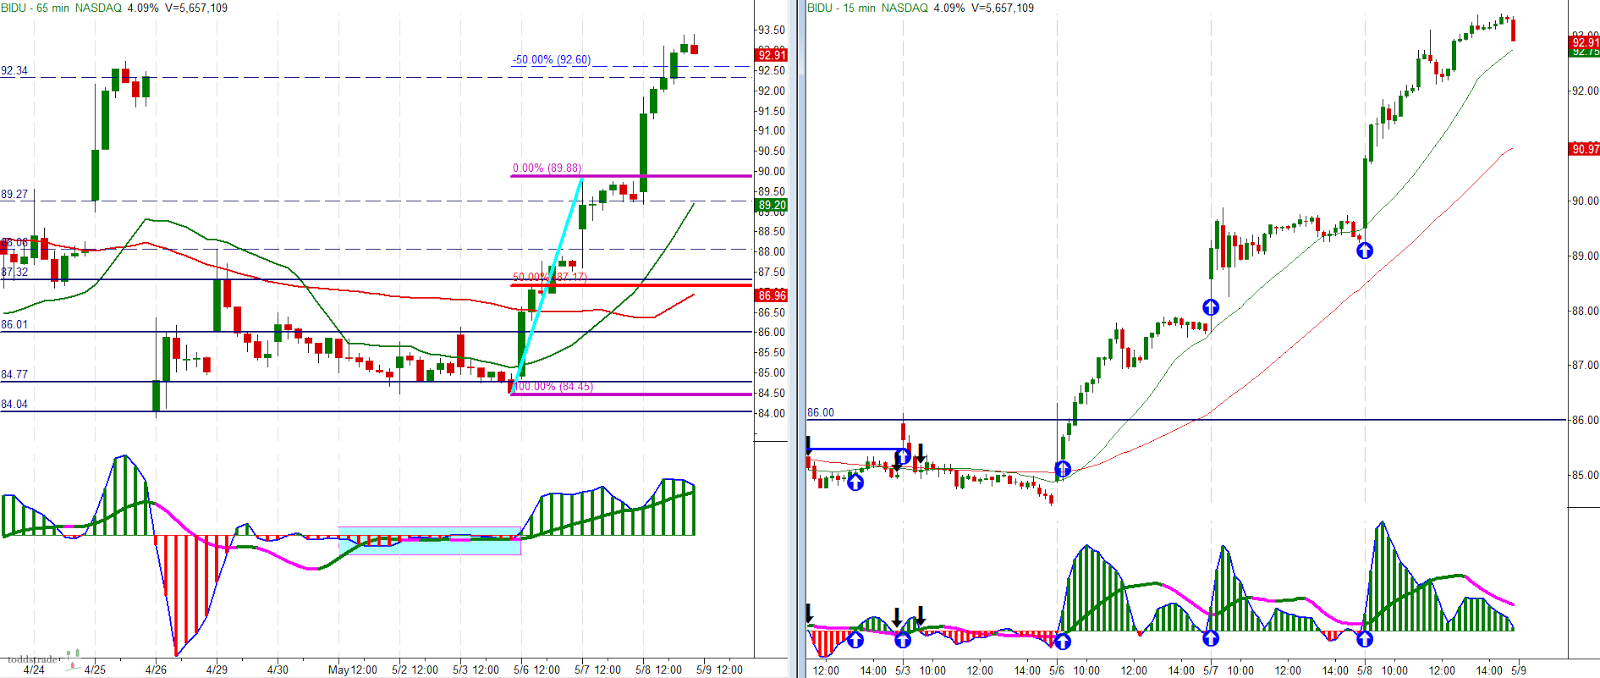
There were some short entries to consider, but I wanted to focus on the 3d criteria setup. Of the 5 potential entries, 2 were scratches and 2 averaged both a $0.50 loss per share (which could have been helped with shorting the failure of the setup. That is, had you waited for the fast line and slow line cross to tell you to get out, depending upon your comfort with reading price action, some of these trades could have been managed for better results. So, at wost, you may have lost $1/share but currently be in a position with an approximately $6/share reward.
Potential triggers after the jump:
- English (UK)
- English (India)
- English (Canada)
- English (Australia)
- English (South Africa)
- English (Philippines)
- English (Nigeria)
- Deutsch
- Español (España)
- Español (México)
- Français
- Italiano
- Nederlands
- Português (Portugal)
- Polski
- Português (Brasil)
- Русский
- Türkçe
- العربية
- Ελληνικά
- Svenska
- Suomi
- עברית
- 日本語
- 한국어
- 简体中文
- 繁體中文
- Bahasa Indonesia
- Bahasa Melayu
- ไทย
- Tiếng Việt
- हिंदी
Watching BIDU, Difficult Triggers
Published 05/09/2013, 07:19 AM
Updated 07/09/2023, 06:31 AM
Watching BIDU, Difficult Triggers
Latest comments
Loading next article…
Install Our App
Risk Disclosure: Trading in financial instruments and/or cryptocurrencies involves high risks including the risk of losing some, or all, of your investment amount, and may not be suitable for all investors. Prices of cryptocurrencies are extremely volatile and may be affected by external factors such as financial, regulatory or political events. Trading on margin increases the financial risks.
Before deciding to trade in financial instrument or cryptocurrencies you should be fully informed of the risks and costs associated with trading the financial markets, carefully consider your investment objectives, level of experience, and risk appetite, and seek professional advice where needed.
Fusion Media would like to remind you that the data contained in this website is not necessarily real-time nor accurate. The data and prices on the website are not necessarily provided by any market or exchange, but may be provided by market makers, and so prices may not be accurate and may differ from the actual price at any given market, meaning prices are indicative and not appropriate for trading purposes. Fusion Media and any provider of the data contained in this website will not accept liability for any loss or damage as a result of your trading, or your reliance on the information contained within this website.
It is prohibited to use, store, reproduce, display, modify, transmit or distribute the data contained in this website without the explicit prior written permission of Fusion Media and/or the data provider. All intellectual property rights are reserved by the providers and/or the exchange providing the data contained in this website.
Fusion Media may be compensated by the advertisers that appear on the website, based on your interaction with the advertisements or advertisers.
© 2007-2025 - Fusion Media Limited. All Rights Reserved.
