While the U.S. dollar closed Monday slightly higher against its major counterparties, except the euro, investors are looking forward to the U.S. President Trump’s speech before the joint session of Congress today during the U.S. evening session. Investors expect Mr. Trump to share details regarding his tax plans, mainly due to his recent comments about announcing a “phenomenal” tax plan soon. However, Trump has recently stated that he is going to disappoint people who are expecting him to reveal the tax reforms plans, since he is not going to release the tax plans before he develops a proposal to replace Obamacare.
Rather than tax policy, he is going to pay attention to the infrastructure and security spending, which are both affecting the fiscal budget and consequently the U.S. dollar. The big loser of Monday was the Canadian dollar followed by the Japanese yen with the USD/CAD closing the day +0.62% and the USD/JPY closing +0.5%. The U.S. dollar found some support yesterday on President’s comments that he is going to announce something “big” today during his speech regarding government’s spending. We believe that the main reason that the greenback was falling the last few days was investors’ disappointment hearing a lot from the Fed and the President but none of the statements being implemented. 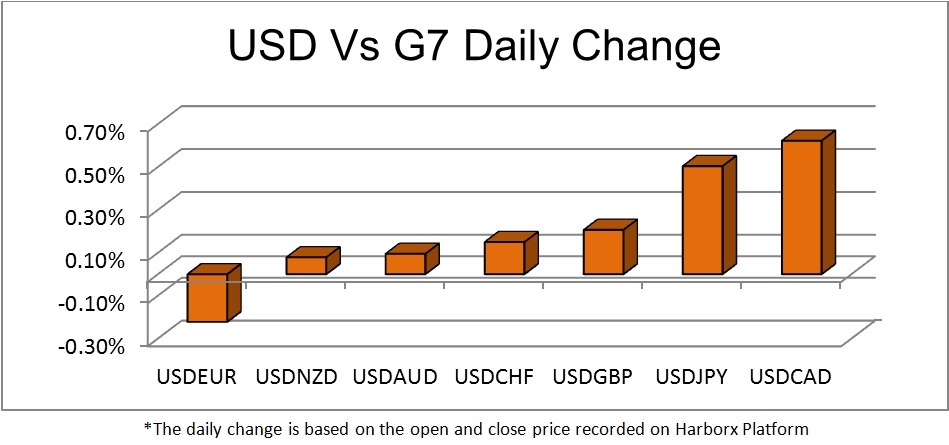
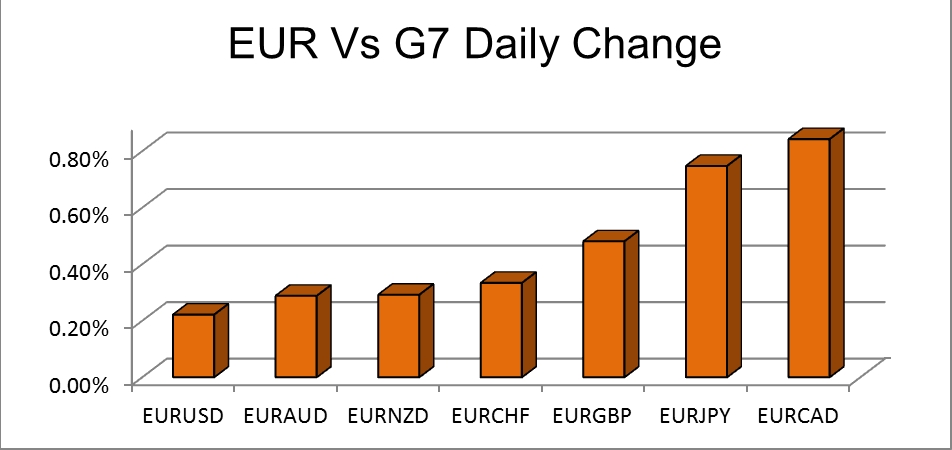
It’s worth pointing out that the euro closed the day higher against all of the G7 members, in contrast to the Canadian dollar which closed Monday lower against all of the major currencies. The euro was supported by the release of the strong European economic sentiment data yesterday, indicating confidence of the European consumers. On the other hand, the Canadian dollar was driven by OPEC members’ comments that the commitments of non-OPEC members to cut the production are still valid and strong. Since euro rose and the Canadian dollar dropped, EUR/CAD that appreciated by 0.84% on Monday.
There is an interesting pattern on the EUR/CAD chart which could trigger some trading opportunities in the short-term. Moreover, there is the interest rate decision of the Bank of Canada on Wednesday which can make the EUR/CAD pair even more attractive to investors. 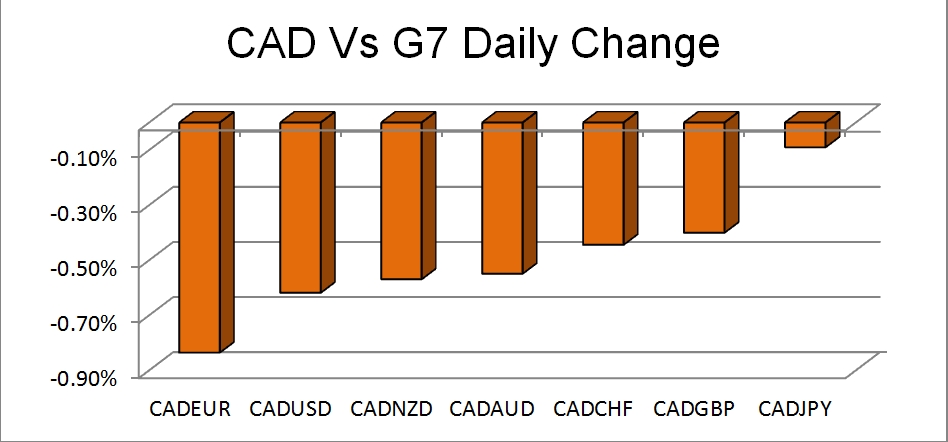
Technical View
EUR/USD
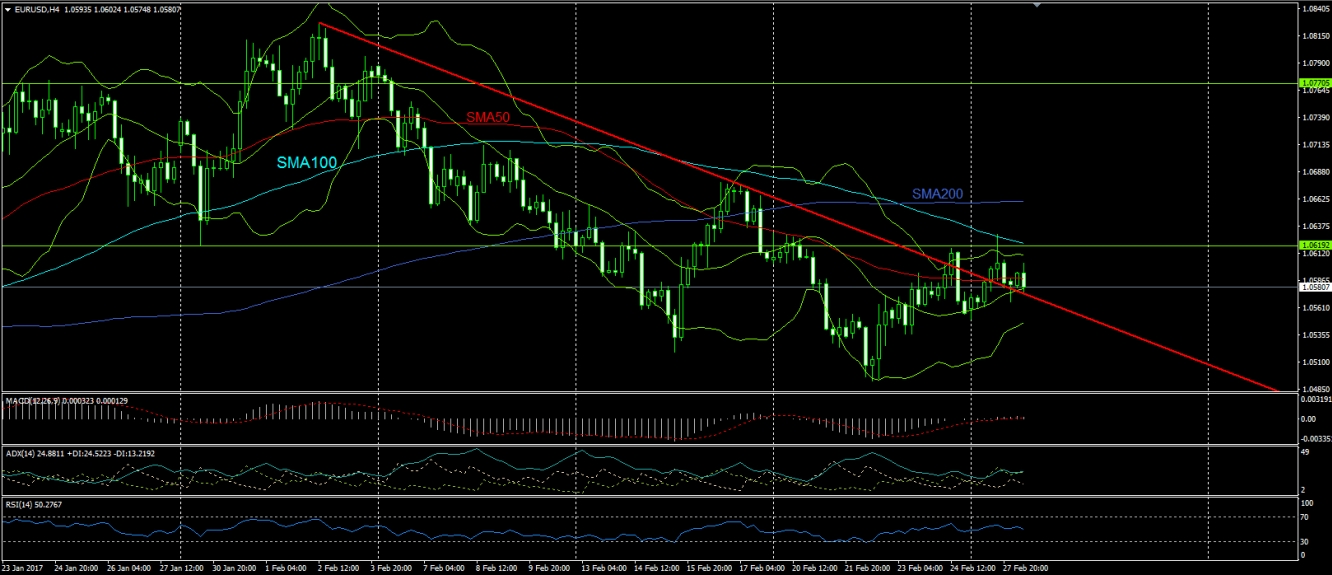
The world’s most traded currency did not manage to penetrate the level of 1.062 on a closing basis, however it is still trying to break the downtrend line on the 4-hour chart as the break is not valid yet with no higher high in place. The price is oscillating at the time of writing between Bollinger’s upper and middle band, MACD and RSI are still on neutral levels while the ADX has turned into positive directional movement signals. If the price penetrates the level of 1.062 (which coincides with SMA100) on a closing basis, then we see it higher at the next valid resistance level of 1.067. On the other hand, if the price turns below 1.057 and the downtrend line then we see the price lower at the support of 1.053 and 1.05 upon penetration of the first one.
On the hourly chart, a short-term uptrend has been created with the price trading between the triple SMAs at the time of writing. MACD and RSI are on neutral levels but they are both slopping downwards while ADX indicates no clear directional movement. The strongest support on the near-term timeframe at the time of writing is SMA100 which coincides with Bollinger’s lower band at 1.057 and the next valid support is near 1.055 where there is the latter low of the uptrend. On the flip side, the valid resistance levels are near the psychological level of 1.06 and 1.063 upon penetration. 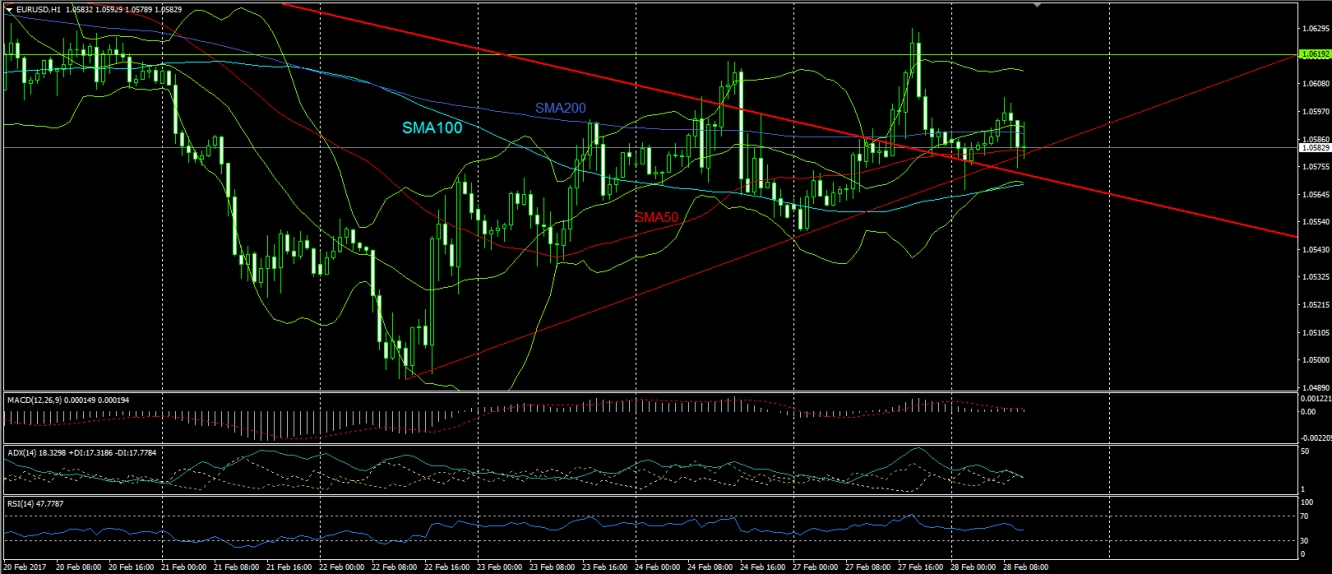
GBP/USD
The Cable is still trading between a trading range on the hourly chart, above the level of 1.24 and below the triple SMAs. RSI and MACD are slopping to the downside while ADX indicates negative directional movement. Another trial of the pair to break the psychological support of 1.24 is possible while upon penetration of it we are looking at the supports of 1.235 and 1.23. On the flip side, the valid resistance levels are near 1.2475 and 1.251. 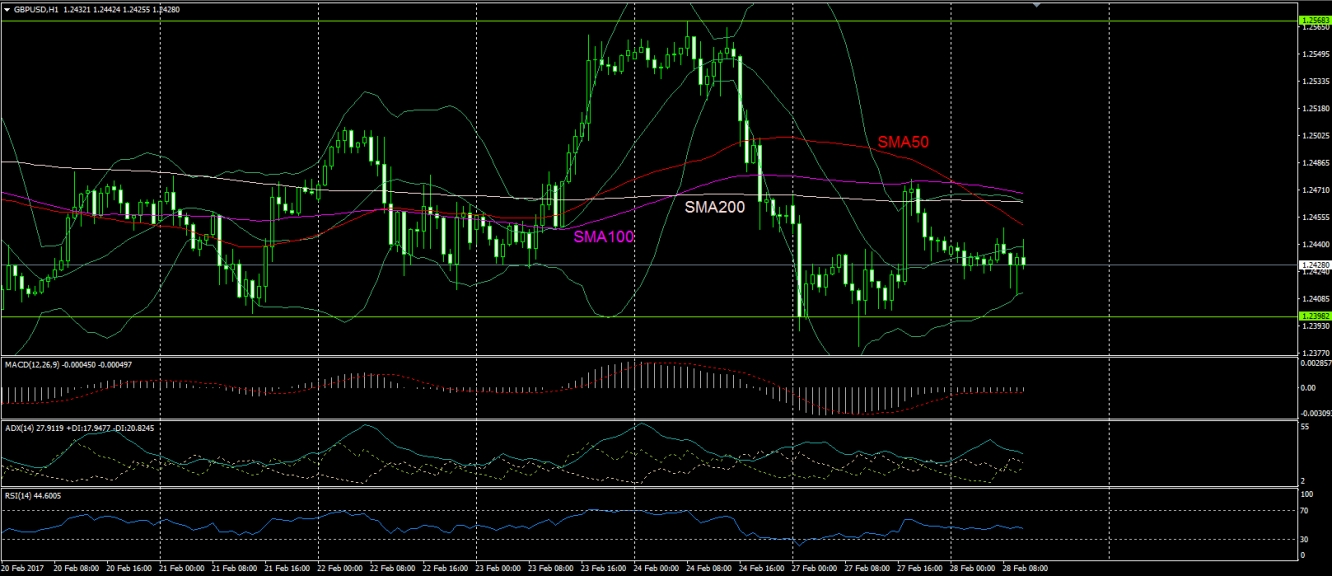
USD/CHF
The pair is trading above the uptrend line on the 4-hour chart while at the time of writing the price is near the next low of the uptrend. If the pair tests the level of 1.002 again and then moves to the upside, this would be a good opportunity for the bulls. However, since the price is near the low levels of the trend, the indicators are near their neutral territories instead of indicating bullish signals and ADX indicates no clear directional movement. As long as USD/CHF is trading above the trendline, the overall picture remains bullish and we believe the swings are good entry points. In the case that the price crosses below the psychological support of the parity level, one should watch closely for a possible reversal. The valid supports are the levels of 1.002, which coincides with the bullish cross of SMA200 and SMA100, and the parity level at 1 while the resistances are near 1.009 and 1.014. 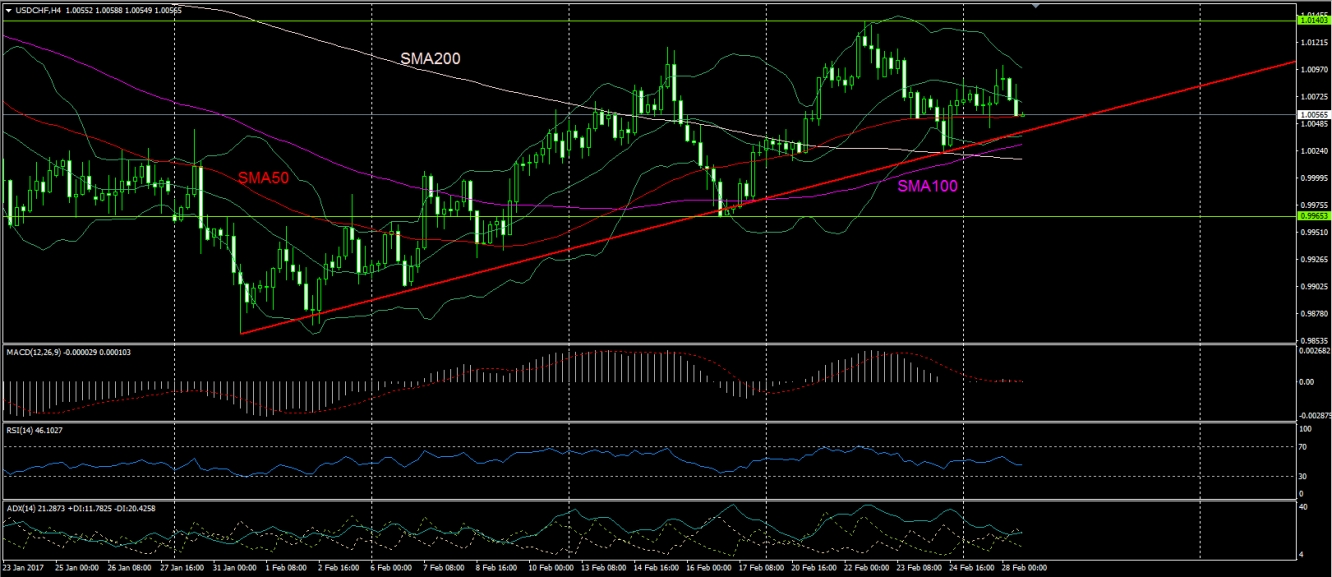
EUR/CAD
The rise of the euro and the drop of the Canadian dollar boosted the EUR/CAD by more than 100 pips up to the level of 1.397 which is the upper band of the rectangle formation in which the pair is trading for the last few days. The question now is whether the rectangle will persist and the price will fall again or it will break and a new uptrend will be formed. MACD and RSI are both slopping upwards while Stochastic is slopping down above the overbought level. If the price breaks the upwards the level of 1.397 then the next valid target to the upside is the level of 1.4 and upon penetration we are looking for the level of 1.405. On the other hand, if the rectangle persists then we see the price downwards to the support of 1.39 and 1.385 thereafter. 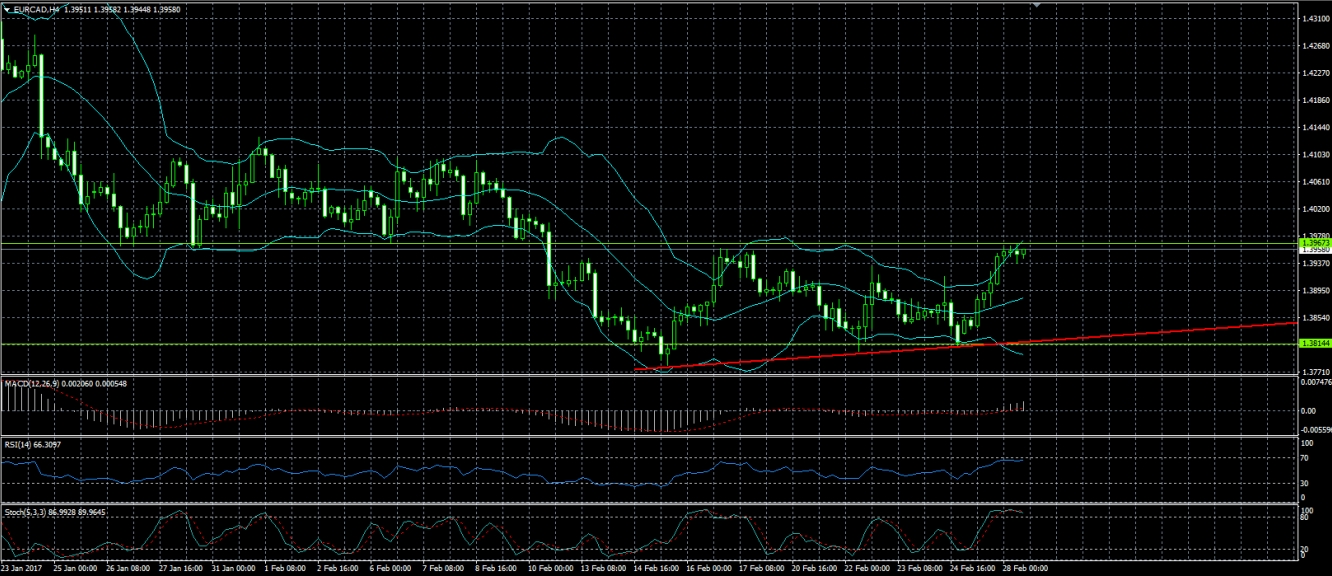
Disclaimer: This material is provided as a general marketing communication for information purposes only and does not constitute an independent investment research. Nothing in this communication contains, or should be considered as containing, an investment advice or an investment recommendation or a solicitation for the purpose of buying or selling of any financial instrument. Users acknowledge that any investment in FX and CFDs products is characterized by a certain degree of uncertainty and that any investment of this nature involves a high level of risk for which the users are solely responsible and liable. We assume no liability for any loss arising from any investment made based on the information provided in this communication. This communication must not be reproduced or further distributed without our prior written permission.
