Looks like we’ve got quite the indicators to watch in our copper price outlook.
To wit, my colleagues wrote last month, “In many respects, copper is Alfred Hitchcock’s ‘Psycho’! On the one hand, the metal reacts to the whims of the market, and on the other hand, copper prices react to actual supply and demand.”
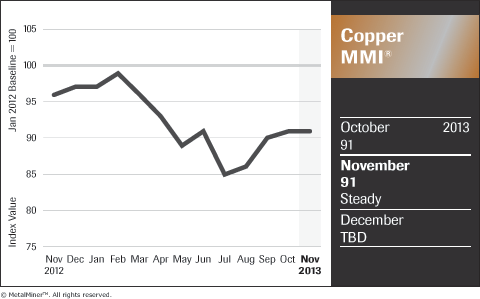
Reflecting this, the opposing forces balanced each other out and MetalMiner’s Copper MMI® for November held steady at 91:

Putting aside investors’ and speculators’ sentiment for a moment, analysts arguing on the basis of fundamentals maintain that supply seems strong, and some might argue we will actually have a refined metal surplus next year.
MetalMiner was skeptical on this at the beginning of the month of November; in the near term, however, it looks as though some inventory clues may support a price spike.
Economic Indicators Affecting Copper Prices
We at MetalMiner track the following: US advanced GDP, China industrial production, China inflation, whether Federal Reserve Chairman Ben Bernanke speaks, and China’s trade balance, just to isolate a few indicators. These and more impact the day-to-day prices of copper. Also, recent copper outflows from ETFs backed by physical copper suggest a bearish investor viewpoint on the market, with many folks calling for copper prices to fall by 8 percent by the end of 2013.
At the start of November, LME copper prices hovered above the $7,200 per ton mark, while primary cash and wire prices in China fell slightly.
Latest Indicator: Comex Copper Inventory
According to a note we got from copper industry watcher John Gross, the inventory balance playing out on the Comex right now is nothing to scoff at.
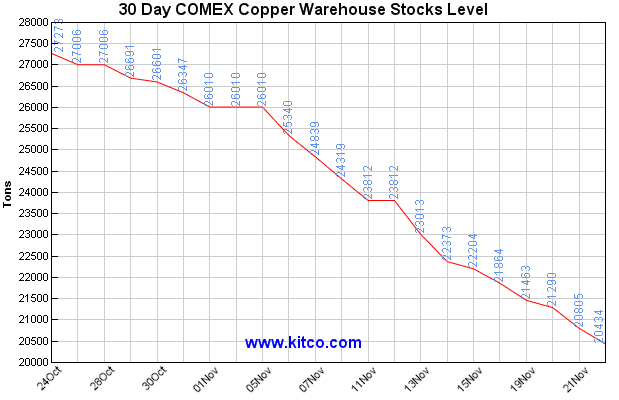
Case in point: “Inventories of copper held in Comex warehouses rose to a high of 77,963 mt during the week of May 10, 2013. Since then, copper stocks have declined 59,089 mt, or 76% to stand at just 18,874 mt” as of late last week, according to Gross. “As a point of reference, this is the lowest level of copper held in Comex warehouses since December 2008.”
“Ok, so what?” you may say.
“Why is this important?” Gross counters. “Currently, open interest in December stands at 47,520 contracts, equivalent to 538,868 mt of commitments, as compared to the 18,874 mt available to fulfill those obligations.”
So put differently, Comex inventory doesn’t hold nearly enough metal to cover contract demand.
The November-December spread has been in a minor backwardation over the past two weeks, according to Gross, closing at -1.25 cents on Friday, Nov. 22. ”If Comex inventories continue declining, correspondingly, the potential of a more significant backwardation arising should not be ignored,” according to Gross. (Backwardation 101: remember, backwardation happens when the spot price is higher than the future price, signaling that demand is high in the near term.)
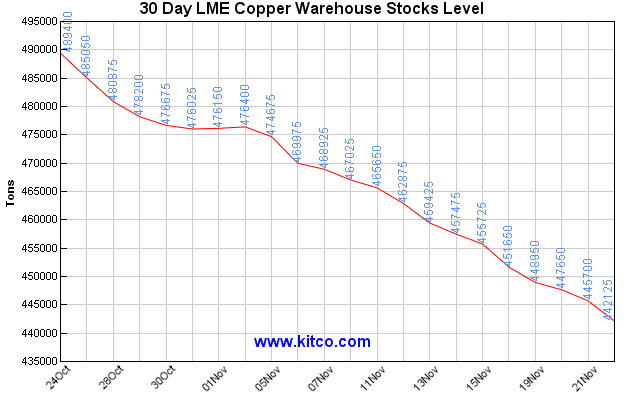
Not only that, but copper inventories have been dropping on both the LME (see graph below) and on the SHFE (down from 51,364 tons on Nov. 18 to 40,737 tons on Nov. 25).

