One of my favorite tools for monitoring the health of an economy is imports. Imports naturally increase when the economy expands, and contracts as the economy recesses. Most pundits watch trade balances as it is felt this is a measure of the competitiveness of the economy.
- when the trade balance change is negative and growing more negative, many feel the home team is losing its global edge;
- conversely a change positive and growing trade balance means the economy is lean and mean.
Although there is some truth in this way of thinking, the trade balance month-to-month movements may not say much about the competitiveness of one economy compared to other economies. A simple move in the price of crude materials moves the balances, and is no measure of competitiveness.
From my last post analyzing the trade balance:
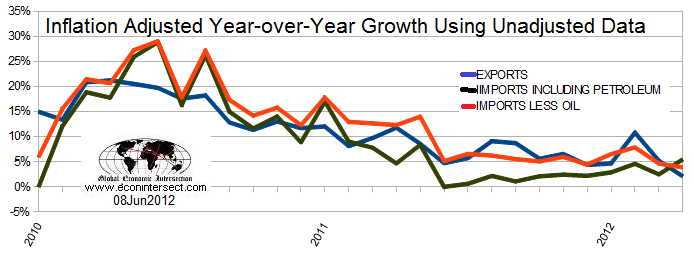
As shown in the above graph:
- import growth with oil has been trending up since mid-2011
- import growth less oil (red line above) has dropped below its trend channel. (One month of bad data is not a trend.)
- Exports (blue line) fell significantly this month, likely indicative of a cooling global economy.
I would not consider the data excellent this month with the deterioration of exports. The seasonally adjusted numbers the BEA has reported makes the trade data look better than what it is for exports. Note: This is a rear view look at the economy.
I watch the “imports less oil” which has been deteriorating over the last two months. This tells me the USA economy is slowing, but this data is two months old, and its trend (which would be used to forecast) is arguable.
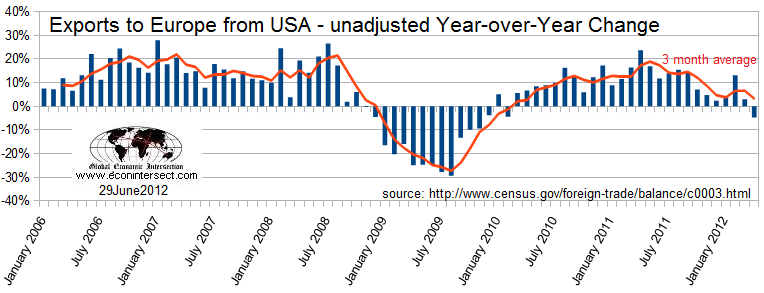
However, what is going on in Europe is clearer as the trends are obvious. What is an export to the USA is an import to Europe. The graph below clearly shows the degradation of European imports beginning in mid-2011. 
Unless this trend reverses, it is likely Europe as a whole is already in a recession. One can use this data set and trends to suggest Europe’s recession began in April or May – but it will be months until enough data is available to confirm this.
However, based on other data we are seeing from Europe, it is not a stretch to believe Europe is already in a recession.
Other Economic News this Week:
The Econintersect economic forecast for July 2012 shows continues to show moderate growth. Overall, trend lines seem to be stable even with the fireworks in Europe, and emotionally cannot help thinking this is the calm before the storm. There are no recession flags showing in any of the indicators Econintersect follows which have been shown to be economically intuitive. There is no whiff of recession in the hard data – even though certain surveys are at recession levels.
ECRI stated in September 2011 a recession was coming . Their data looks ahead at least 6 months and the bottom line for them is that a recession is a certainty. The size and depth is unknown but the recession start has been revised to hit around mid-year 2012.
The ECRI WLI index value is again solidly in negative territory with a downward trend. The index is indicating the economy six month from today will be slightly worse than it is today. As shown on the graph below, this is not the first time since the end of the Great Recession that the WLI has been in negative territory. 
Initial unemployment claims decreased from 387,000 (reported last week) to 386,000 this week. Historically, claims exceeding 400,000 per week usually occur when employment gains are less than the workforce growth, resulting in an increasing unemployment rate (background here and here). The real gauge – the 4 week moving average – rose from 386,250 (reported last week) to 386,750. Last week was the largest unemployment number this year. Because of the noise (week-to-week movements from abnormal events AND the backward revisions to previous weeks releases), the 4-week average remains the reliable gauge.
Data released this week which contained economically intuitive components (forward looking) was rail movements (which was growing this week with or without considering coal transport). All other data released this week does not have enough correlation to the economy to be considered intuitive.
Weekly Economic Release Scorecard:
Click here to view the scorecard table below with active hyperlinks.
Bankruptcies this Week: Ritz Camera & Image
