Recent increases in economic activity in the U.S. show consumers have been spending part of their incomes, savings and the latest round of stimulus checks.
According to the “Monthly Economic Review: April 2021” released by the National Retail Federation:
“Households finished 2020 in a very healthy state…. This provides consumers with plenty of purchasing power that we expect to see put to use across consumer industries. These include but are not limited to groceries and household products, home improvement purchases and technology products. At the same time, a rebound in consumer-facing services should be evident.”
In addition to the optimistic forecast by the retail federation, recent numbers released by the Census Bureau also show that retail and food services sales increased 9.8% in March from February 2020 and 27.7% year-over-year.
In March, the Census Bureau reported:
“Double-digit increases were seen for sporting goods (23.5%), clothing (18.3%), motor vehicles (15.1%), food services and drinking places (13.4%), building materials (12.1%), gasoline stations (10.9%), electronics and appliances (10.5%).”
The April 2021 “Advance Monthly Retail” report will be released May 14. Given the increased level of vaccine rollout and pent-up consumer demand, the metrics could be strong.
Therefore, today we introduce two exchange-traded funds that could appeal to a range of readers who believe the U.S. consumer will continue to spend in the months ahead.
1. VanEck Vectors Retail ETF
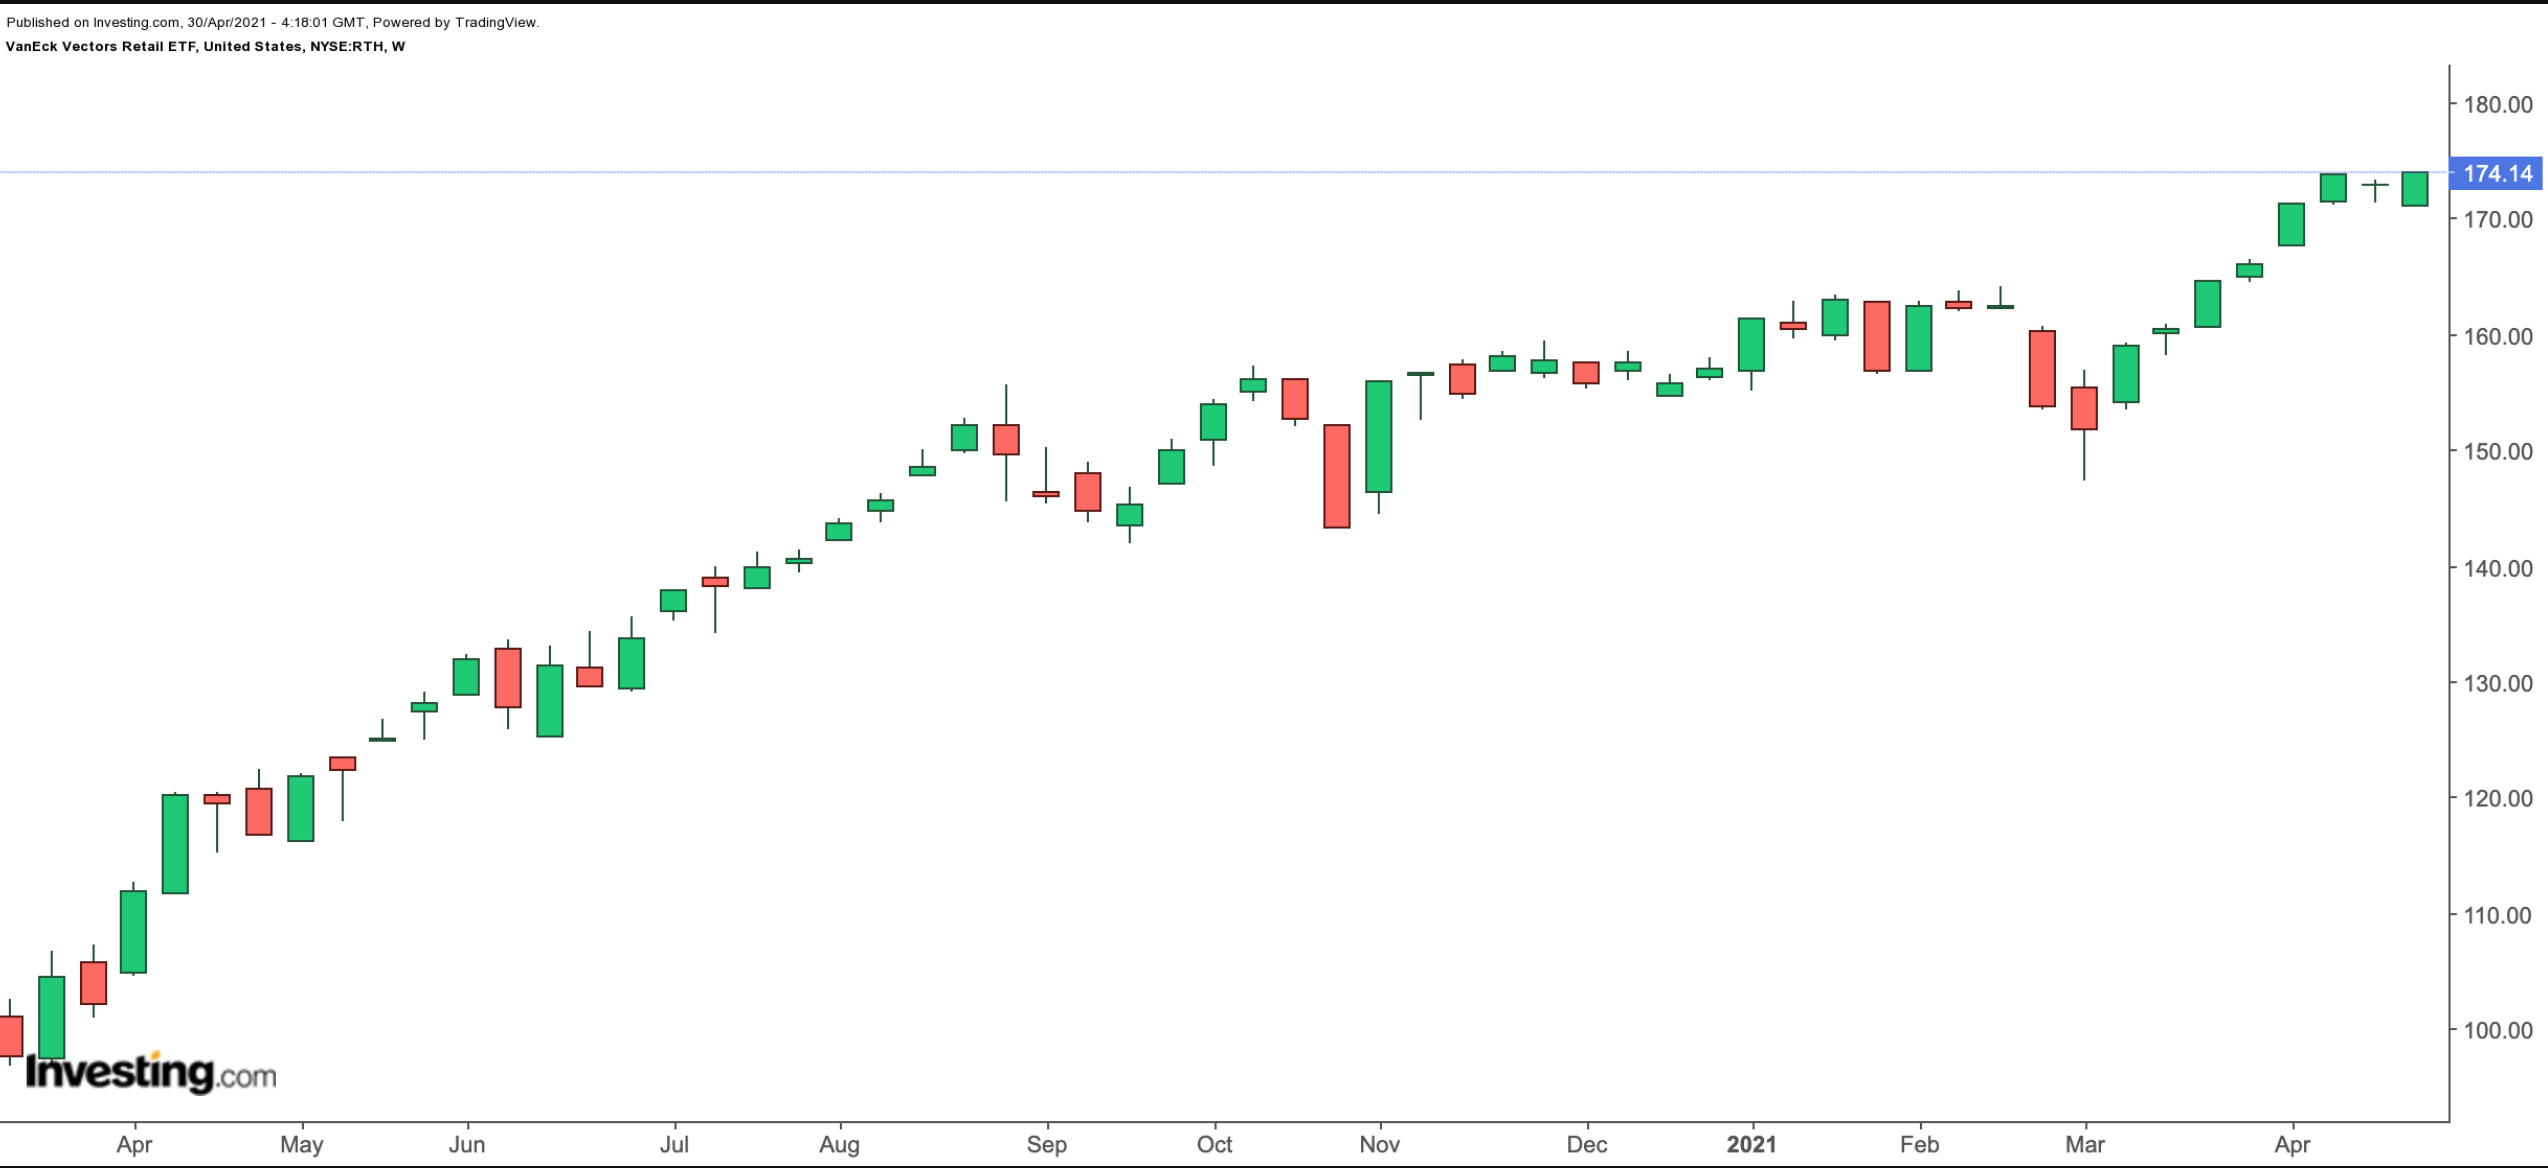
Current Price: $174.14
52-Week Range: $116.20 - $174.14
Dividend Yield: 1.21%
Expense Ratio: 0.35% per year
The VanEck Vectors Retail ETF (NYSE:RTH) invests mainly in retailers, wholesalers and e-commerce businesses with market caps exceeding $150 million. The fund started trading in December 2011 and has $246 million in net assets.

RTH, which tracks the performance of the MVIS® US Listed Retail 25 Index, currently has 25 holdings. Consumer discretionary, the segment that benefits when people have a little extra cash available, is the leading segment with a 69.1% share. Next are consumer staples (21.7%) and health care (9.2%). Over 71% of the funds is in the top 10 stocks.
E-commerce juggernaut Amazon.com (NASDAQ:AMZN); home improvement retailers Home Depot (NYSE:HD) and Lowe’s Companies (NYSE:LOW); Walmart (NYSE:WMT), the world’s largest retailer in terms of sales; and membership warehouses operator Costco Wholesale (NASDAQ:COST) are among the leading names in the roster.
As AMZN stock’s weighting in the fund is close to 20%, a large move in the shares will affect the price of the ETF. The company reported Q1 earnings on Apr. 29, and the shares had been volatile in anticipation of the results. The only non-U.S. company among the holdings is Chinese e-commerce group JD.Com (NASDAQ:JD).
Year-to-date, the ETF is up more than 9% and hit a record high in recent days. Anecdotal evidence as well as recent consumer metrics show that discretionary stocks have been benefiting from stimulus money. Those investors who are bullish on the top names in the fund-—especially Amazon—could consider buying the dips in RTH.
Ecofin Digital Payments Infrastructure Fund
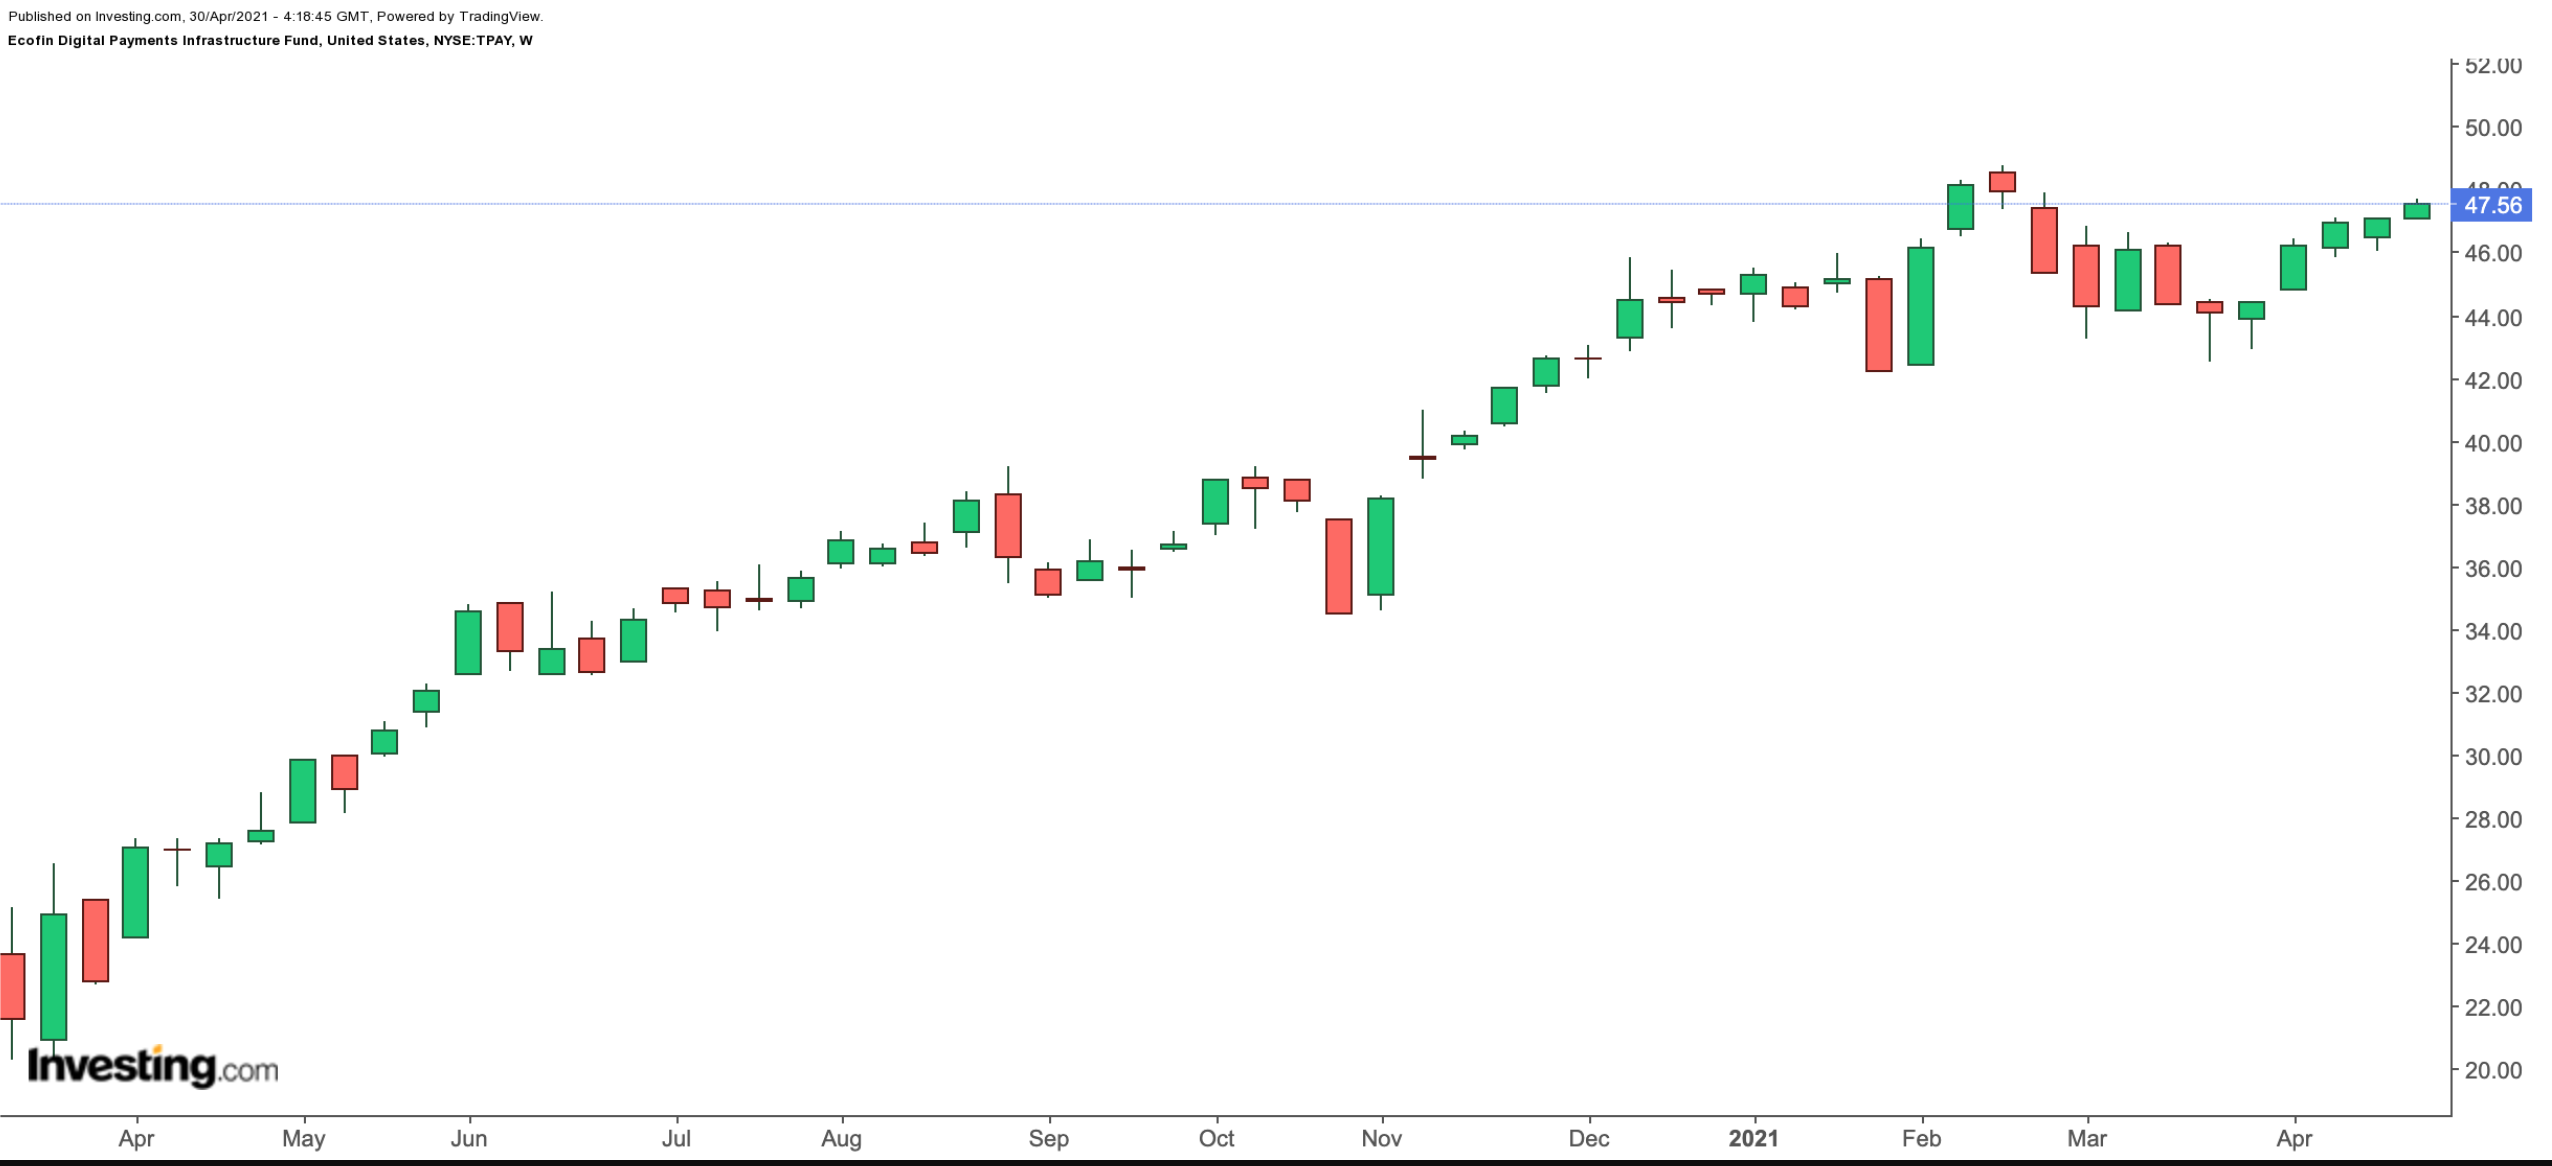
Current Price: $47.56
52-Week Range: $27.14 - $48.79
Dividend Yield: 0.21%
Expense Ratio: 0.40% per year
From shopping, we move on to the related area of digital payments, or transactions “carried out through a digital medium with no physical exchange of money…. The Global Digital Payment Market size is expected to reach $175.8 billion by 2026, rising at a market growth of 20% CAGR.”
The pandemic has accelerated the shift from cash to digital payments. Therefore, our next fund, the Ecofin Digital Payments Infrastructure Fund (NYSE:TPAY), could appeal to readers who believe shoppers will continue to rely on digital transactions to pay for their shopping. This ETF gives access to global companies that are part of the digital payment value chain. These businesses typically include credit card networks, electronic transaction processors, merchant payment services and real-time record keeping firms.

TPAY currently has 55 holdings, and the top 10 stocks comprise around 40% of net assets of $14.2 million. The fund was launched on Jan. 31, 2019. In other words, it is still a small and relatively young fund.
Among the leading businesses are the French payment service provider Worldline (PA:WLN), Dutch payment solutions group Adyen (OTC:ADYEY), commerce ecosystem Square (NYSE:SQ), digital payments platform PayPal (NASDAQ:PYPL) and DocuSign (NASDAQ:DOCU), which specializes on electronic signature solutions.
Since the start of the year, TPAY has returned about 7% and saw an all-time high in February. Those investors who believe the secular trend regarding digitalization worldwide could consider investing in the fund, especially if there is a short-term decline toward the $45 level.
