Now, we should caution that we are not personally great followers of the chartists, by which we mean those analysts who seek to predict future price movements on the basis of the shape of previous price curves.
There are plenty of situations they can point to where commodity prices have faithfully followed pre-determined waves, the peaks and troughs of which are predicted on the basis of their Fibonacci ratio analysis.
Fibonacci analysis is based on a series of numbers developed by Italian mathematician Leonardo Fibonacci in the 12th century and while I am not going to go into any more detail here on how it works, the essence is the technique is supposed to predict likely inflection points where the price will find support or resistance, and as a result slow its fall, or rise, or even change direction.
The fact that I don’t place great store on a system developed by the undoubtedly eminent mathematician is not to say analysis using his principals do not influence the market.
Enough traders use chartist direction signals for their prediction to become, to an extent, self-fulfilling. Like all analysis, of course, it is open to interpretation; depending on when you start the timeline for the wave analysis, you can see short-term wave patterns in conflict with long-term patterns, so to say it’s complicated is probably an understatement.
Nevertheless, as a New Year exercise it’s intriguing to see what Reuters’ full-time chart analyst Wang Tao has to say about metals and energy prices. His full report also contains soft commodities, but we’re no pansies, so we won’t cover those here. First up: Gold.
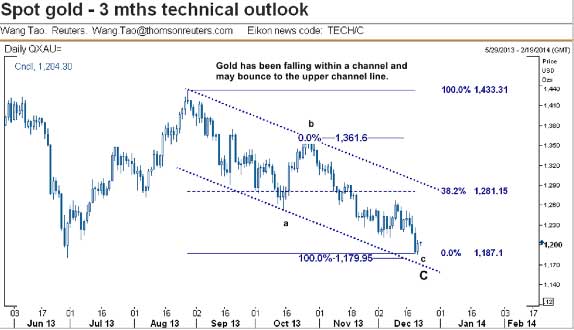
Firstly, of the precious metals, gold is headed for a fall later this quarter in spite of current strength that could carry it to $1,281 per ounce, the article suggests. The last peak was on Aug. 28 with a high of $1,433.31. 
From that level, gold has been falling within a channel and Reuters suggests the lower channel line provides support at $1,180, the 100% Fibonacci projection level of a downward wave C. This support is interestingly spot on the June 28 low of $1,180.71. This support, together with the one at $1,200, has formed a strong support zone, the analysis suggests, which will force gold to bounce later in the year towards the upper channel line of $1,281, the 38.2% level – another key inflection point.
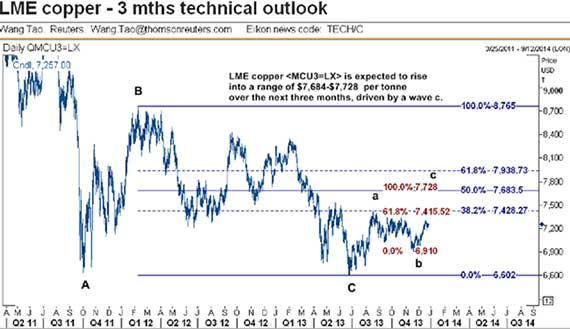
Copper as expressed on the LME is expected to rise into a range of $7,684 to $7,728 per metric ton over the next three months. 
That’s something of a bullish call, but arguably may have offered support for copper’s recent strength, which some analysts have been surprised about.
Aluminum’s story is considerably more gloomy, although those following its price will probably not be surprised to hear it may continue its divergence from a linkage to copper. For the last couple of years, these two metals have shown close correlation at least for price direction, but recently the relationship has broken down – a fall in aluminum with a rise in copper is much more plausible now than 12 months ago.
by Stuart Burns
- English (UK)
- English (India)
- English (Canada)
- English (Australia)
- English (South Africa)
- English (Philippines)
- English (Nigeria)
- Deutsch
- Español (España)
- Español (México)
- Français
- Italiano
- Nederlands
- Português (Portugal)
- Polski
- Português (Brasil)
- Русский
- Türkçe
- العربية
- Ελληνικά
- Svenska
- Suomi
- עברית
- 日本語
- 한국어
- 简体中文
- 繁體中文
- Bahasa Indonesia
- Bahasa Melayu
- ไทย
- Tiếng Việt
- हिंदी
Wang Tao And Fibonacci: Bedfellows On Gold, Copper Price Direction
Published 01/13/2014, 07:33 AM
Updated 07/09/2023, 06:31 AM
Wang Tao And Fibonacci: Bedfellows On Gold, Copper Price Direction
Latest comments
Loading next article…
Install Our App
Risk Disclosure: Trading in financial instruments and/or cryptocurrencies involves high risks including the risk of losing some, or all, of your investment amount, and may not be suitable for all investors. Prices of cryptocurrencies are extremely volatile and may be affected by external factors such as financial, regulatory or political events. Trading on margin increases the financial risks.
Before deciding to trade in financial instrument or cryptocurrencies you should be fully informed of the risks and costs associated with trading the financial markets, carefully consider your investment objectives, level of experience, and risk appetite, and seek professional advice where needed.
Fusion Media would like to remind you that the data contained in this website is not necessarily real-time nor accurate. The data and prices on the website are not necessarily provided by any market or exchange, but may be provided by market makers, and so prices may not be accurate and may differ from the actual price at any given market, meaning prices are indicative and not appropriate for trading purposes. Fusion Media and any provider of the data contained in this website will not accept liability for any loss or damage as a result of your trading, or your reliance on the information contained within this website.
It is prohibited to use, store, reproduce, display, modify, transmit or distribute the data contained in this website without the explicit prior written permission of Fusion Media and/or the data provider. All intellectual property rights are reserved by the providers and/or the exchange providing the data contained in this website.
Fusion Media may be compensated by the advertisers that appear on the website, based on your interaction with the advertisements or advertisers.
© 2007-2025 - Fusion Media Limited. All Rights Reserved.
