
Supermarket giant, Wal-Mart Stores, Inc. (NYSE:WMT) posted third-quarter fiscal 2018 results, wherein both earnings and revenues improved year over year and exceeded the Zacks Consensus Estimate. Notably, this marked Walmart’s ninth consecutive quarter of positive earnings surprise. The splendid quarter also encouraged management to raise earnings outlook for fiscal 2018.
Wal-Mart Stores, Inc. Price, Consensus and EPS Surprise
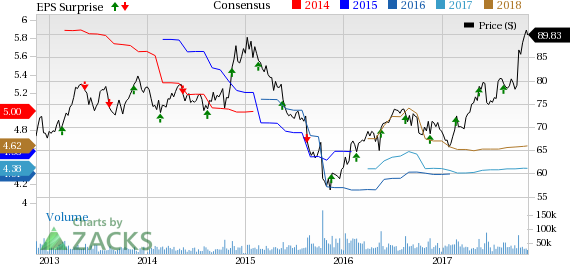
Wal-Mart Stores, Inc. Price, Consensus and EPS Surprise | Wal-Mart Stores, Inc. Quote
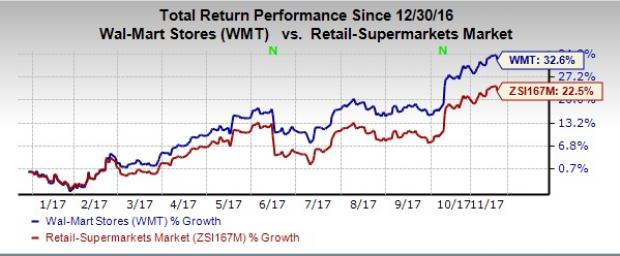
Clearly, these factors boosted investors’ sentiment as this Zacks Rank #3 (Hold) stock is up more than 4% in the pre-market trading session. Moreover, the company’s robust past performance and solid endeavors to augment its e-commerce business have helped its shares rally 32.6% year to date, beating the industry’s 22.5% growth.
Quarter in Detail
Walmart’s adjusted earnings of $1.00 per share came ahead of the Zacks Consensus Estimate of 97 cents and grew 2% from 98 cents reported in the year-ago period. Earnings also exceeded the higher end of the guided range of 90 - 98 cents per share.
Total revenues came in at $123.2 billion (including membership and other income) that advanced 4.2% year over year and surpassed the Zacks Consensus Estimate of $121.1 billion. The upside was driven by strength at all three businesses. On a currency-neutral basis, total revenues advanced 3.8% to $122.7 billion.
Total revenues comprised net sales of $122.1 billion (up 4.2% from the year-ago quarter) and membership and other income of more than $1 billion (up 4% year over year).
Operating income declined 6.9% to $4.76 billion, while the operating income margin contracted 40 basis points to 3.9%. On a constant currency basis, operating income declined 8.1% to $4.7 billion.
Segment Details
Walmart U.S.: The segment posted net sales growth of 4.3% to $77.7 billion in the reported quarter. U.S. comparable-store sales (comps), excluding fuel jumped 2.7%, compared with 1.2% growth in the prior-year quarter. Notably, this was the 13th consecutive quarter of positive comps. While comp traffic improved 1.5%, average ticket inched up 1.2% in the quarter. Moreover, e-commerce sales positively impacted comp sales at Walmart U.S. by 80 bps.
Well, the e-commerce growth at Walmart U.S. was manly driven by Walmart.com, with net sales and GMV up 50% and 54%, respectively. Operating income at the segment inched up by 0.8% to over $4 billion.
Walmart International: Segment net sales went up by 4.1% to $29.5 billion. On a currency-neutral basis, net sales improved 2.5% to $29.1 billion. However, operating income declined 7.8% to $1.2 billion. On a constant currency basis, it slumped 12.2%.
Sam’s Club: The segment, which comprises membership warehouse clubs, posted net sales growth of 4.4% to $14.9 billion. Sam’s Club comps, excluding fuel, rose 2.8% compared with 1.4% growth in the prior-year quarter. Notably 10 out 11 markets recorded positive comps, which included the company’s biggest markets.
Comp traffic grew 3.6%, while ticket dipped 0.8%. E-commerce sales positively impacted comps by approximately 80 basis points in the quarter. Operating income at Sam’s Club jumped 12.9% to $447 million.
Other Financial Updates
Walmart ended the quarter with cash and cash equivalents of roughly $7 billion, long-term debt of $34.2 billion, long-term capital lease and financing obligations of $6.7 billion and shareholders’ equity of $78.9 billion.
In the first nine months of fiscal 2018, Walmart generated cash flow from operations of $17.1 billion and incurred capital expenditures of $6.9 billion, resulting in free cash flow of $10.2 billion.
Walmart paid $1.5 billion in dividends during the quarter. The company repurchased about 27 million shares worth $2.2 billion under its $20 billion authorization announced in October 2015. Further, management stated that from Nov 20, it will make buybacks under its October 2017 authorization of $20 billion.
Guidance
4Q18
Walmart expects both U.S. comps (excluding fuel) and Sam’s Club comps (excluding fuel) to increase in a range of 1.5-2.0% for the 13-week period ending Jan 26, 2018.
Fiscal 2018
The company raised its bottom-line view for fiscal 2018 and now envisions adjusted earnings in the range of $4.38-$4.46 per share, as compared with the prior expectation of $4.30-$4.40. GAAP earnings are expected to range from $3.84-$3.92 per share.
Looking for Promising Stocks? Check These Trending Picks
Big Lots, Inc. (NYSE:BIG) , with a long-term earnings growth rate of 13.5% carries a Zacks Rank #2 (Buy). You can see the complete list of today’s Zacks #1 Rank (Strong Buy) stocks here.
Dollar General Corporation (NYSE:DG) carrying a Zacks Rank #2 has an impressive long-term earnings growth rate of 11.3%.
Ross Stores, Inc. (NASDAQ:ROST) delivered an average positive earnings surprise of 6.3% in the trailing four quarters and has a long-term earnings growth rate of 10%. The company carries the same Zacks Rank as Big Lots and Dollar General.
Zacks’ Best Private Investment Ideas
While we are happy to share many articles like this on the website, our best recommendations and most in-depth research are not available to the public.
Starting today, for the next month, you can follow all Zacks' private buys and sells in real time. Our experts cover all kinds of trades… from value to momentum . . . from stocks under $10 to ETF and option moves . . . from stocks that corporate insiders are buying up to companies that are about to report positive earnings surprises. You can even look inside exclusive portfolios that are normally closed to new investors.
Click here for Zacks' private trades >>
Wal-Mart Stores, Inc. (WMT): Free Stock Analysis Report
Dollar General Corporation (DG): Free Stock Analysis Report
Ross Stores, Inc. (ROST): Free Stock Analysis Report
Big Lots, Inc. (BIG): Free Stock Analysis Report
Original post
Zacks Investment Research