This past week Nobel Laureate Professor Paul Krugman OpEd:
Even if Republicans take the Senate this year, gaining control of both houses of Congress, they won’t gain much in conventional terms: They’re already able to block legislation, and they still won’t be able to pass anything over the president’s veto. One thing they will be able to do, however, is impose their will on the Congressional Budget Office, heretofore a nonpartisan referee on policy proposals. As a result, we may soon find ourselves in deep voodoo.
Some time ago I wrote a post on political parties control of the Presidency and Congress - and that lack of correlation to the middle class (both parties were equally bad). Here is a graph from that post taking a median income chart, and overlaying the party in control of Congress.
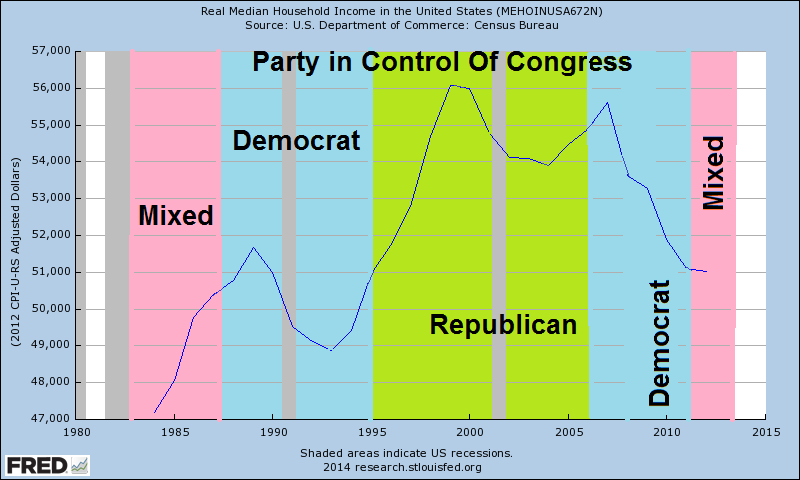
I have on occasion disagreed with the Congressional Budget Office (CBO) findings and estimates - but NEVER perceived a political bias in their work. Their studies on raising the minimum wage did not sit well with the left, and likewise cost estimates on extending the unemployment insurance did not sit well with the right. But even in periods of full control by a single political party - there is no evidence of a new economic bent in their work.
How does the CBO maintain neutrality?:
To ensure that CBO’s cost estimates and other analyses are impartial and nonpartisan, the agency draws on the knowledge and insights of outside experts representing a variety of perspectives and applies an intensive internal review process. It makes no policy recommendations and enforces strict rules to prevent financial conflicts of interest by its employees and to limit its employees’ political activities.
Read more about our transparency and objectivity, which includes a longer discussion of CBO's approach to presenting and explaining its work, links to a variety of documents that provide information about CBO's methodologies, and a statement of our conflict of interest policies.
It is the link abut CBO transparency and and objectivity which should be read by all [click here]. Professor Krugman believes it is dangerous to have a single party in control of Congress (he never objected when Democrats were in full control). Could he be biased?
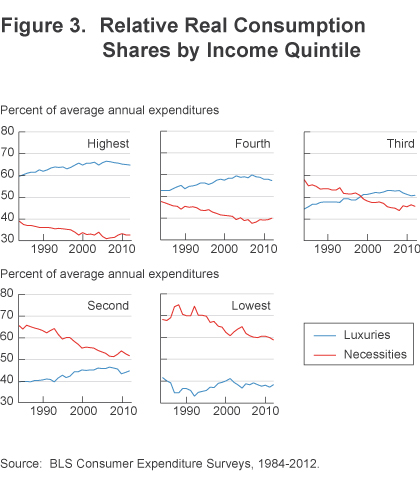
What was important last week was a little read study from the Cleveland Fed which has significant implications relating to consumption shares of luxuries and necessities. From the study:
As figure 3 illustrates, the relative consumption shares of luxuries and necessities vary greatly between income groups. From the different graphs one can see that, as the income level increases, luxury items account for a greater share of the consumer’s market basket. While it is true that all income groups reduced their consumption of necessities over the analysis period, the rate at which they transitioned into consuming greater amounts of luxuries differed greatly across groups. As the results in both table 1 and figure 3 detail, the lowest and highest income quintiles were the most invariant over time with respect to their consumption of luxury goods. Middle income consumers experienced the greatest variation of all the groups. Their consumption of necessities declined by 12.2 percentage points over the analysis period, while their consumption of luxuries increased the most—rising by 6.2 percentage points.
Implications
If income growth continues to lag for lower to middle income groups, two potential long-term implications for future economic growth come to mind. First, while consumption has gradually been rebounding from the recession, current trends in both income growth and income inequality are altering the mix of goods and services that consumers are purchasing. While macroeconomic models tend to focus on average income effects, there may useful information in the disaggregated patterns.
Second, to the extent that consumption of the necessity “education” continues to decline as a share of real consumption for all but the highest income quintile, it may exacerbate the income inequality trend over the coming years; increased education is one of the most reliable paths to increased income. However, the lowest, second-lowest, middle, and second-highest income quintiles have all seen their shares of education decline significantly over the analysis period (8.1 to 2.6 percent, 2.8 to 1.2 percent, 2.5 to 1.1 percent, and 2.6 to 1.6 percent, respectively). The highest income quintile has seen its share of education consumption remain relatively steady, declining only slightly from 3.4 to 3.2 percent.
This study shows generally during some period (the turning point varies by income strata) during the 2000s, necessities have started becoming a larger component of spending. The graph below presents the inflation adjusted mean household income by quintile.
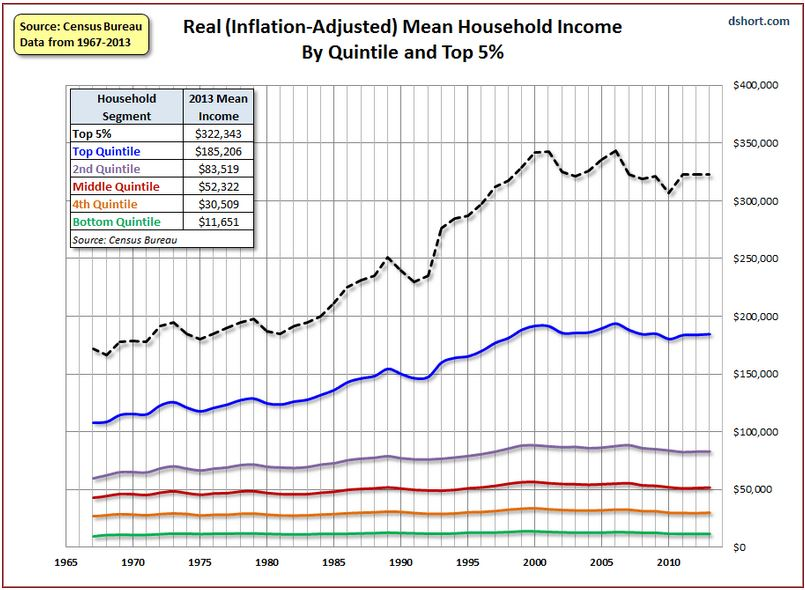
In theory, if real income is flat - the percentages spent on necessities or luxuries should be consistent between periods. They are not. Also it is difficult to understand why the expenditures for luxuries + necessities did not always add to 100% in the study.
In any event, the implications of this Cleveland Fed study merits more review. and paints a picture of a decline in American consumer fiscal health. Professor Krugman worries about a return to VooDoo economics - I worry about those who think the current economic system is working.
Other Economic News this Week:
The Econintersect Economic Index for September 2014 is showing our index declined from last months 3 year high. Outside of our economic forecast - we are worried about the consumers' ability to expand consumption although data is now showing consumer income is now growing faster than expenditures growth. The GDP expansion of 4.2% in 2Q2014 is overstated as 2.1% of the growth would be making up for the contraction in 1Q2014, and 1.4% of the growth is due to an inventory build. Still, there are no warning signs that the economy is stalling.
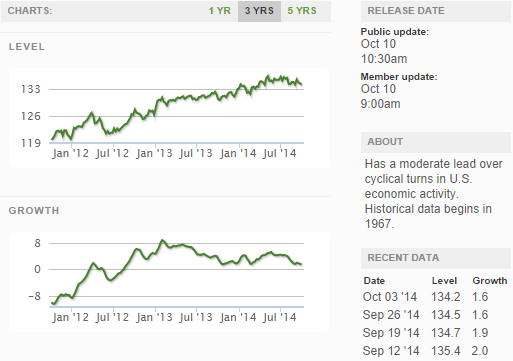
The ECRI WLI growth index value has been weakly in positive territory for almost two years. The index is indicating the economy six month from today will be slightly better than it is today.
Current ECRI WLI Growth Index
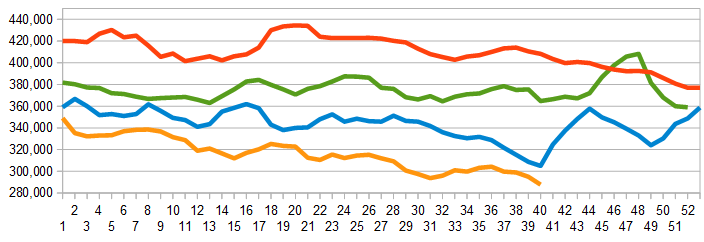
The market was expecting the weekly initial unemployment claims at 285,000 to 295,000 (consensus 293,000) vs the 287,000 reported. The more important (because of the volatility in the weekly reported claims and seasonality errors in adjusting the data) 4 week moving average moved from 295,000 (reported last week as 294,750) to 287,750.
Weekly Initial Unemployment Claims - 4 Week Average - Seasonally Adjusted - 2011 (red line), 2012 (green line), 2013 (blue line), 2014 (orange line)
Bankruptcies this Week: GT Advanced Technologies Inc (NASDAQ:GTAT)
Click here to view the scorecard table below with active hyperlinks
