Volume Adds Depth And Color To Monochromatic Picture

Published 01/15/2020, 02:14 PM
Daily Dow Jones Industrial Average

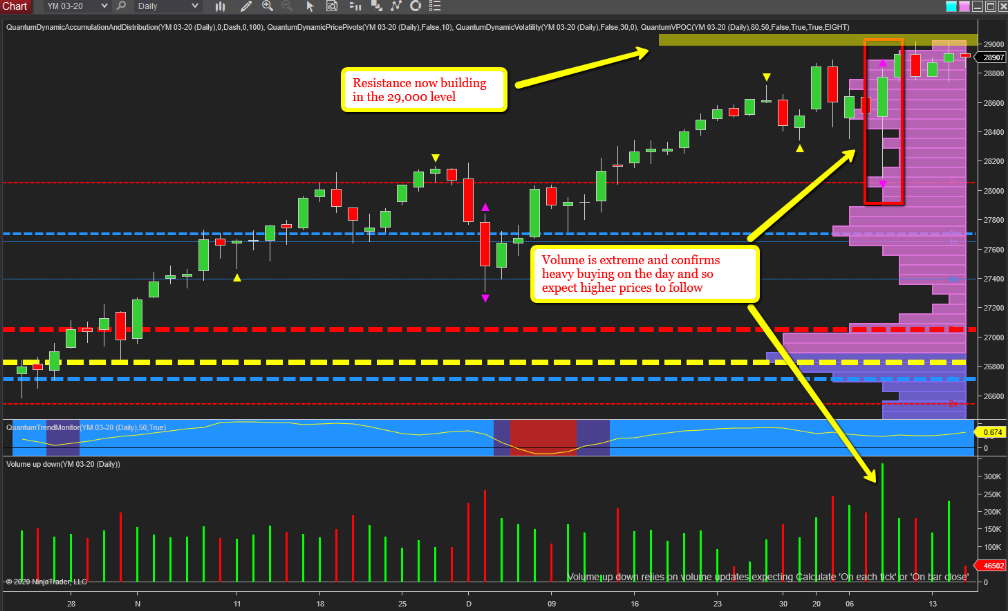
As always, volume reveals the truth behind the price action, and whilst price action alone reveals much, on its own, it is a one dimensional approach. An image in black and white if you will. Volume adds depth and colour to this monochromatic picture and no more so than on the daily chart for the YM emini, the futures contract for the Dow Jones Industrial Average, and in particular the daily candle of the 8th January 2020.

A dramatic day and especially so for intraday traders with wonderful two-way price action, with the candle closing higher and an extreme wick to the lower body of the candle. Buying? Yes most certainly. But, how much, and volume gives us the answer simply and clearly. Extreme volume denotes very heavy buying, and therefore we can expect the market to continue higher and on towards 29,000, after this ‘refuelling stop’ and should the trade agreement between the US and China deliver in a meaningful way, this is likely to provide some further momentum taking us out and into new high ground.

However, resistance is now building in the 29,000 region, but given this is a whole number of some importance, it will be no surprise to see a pause here before the index is propelled higher in the medium term with further buying evident yesterday on very high volume.

Charts from NinjaTrader and indicators from Quantum Trading

Latest comments

Loading next article…
Risk Disclosure: Trading in financial instruments and/or cryptocurrencies involves high risks including the risk of losing some, or all, of your investment amount, and may not be suitable for all investors. Prices of cryptocurrencies are extremely volatile and may be affected by external factors such as financial, regulatory or political events. Trading on margin increases the financial risks.
Before deciding to trade in financial instrument or cryptocurrencies you should be fully informed of the risks and costs associated with trading the financial markets, carefully consider your investment objectives, level of experience, and risk appetite, and seek professional advice where needed.
Fusion Media would like to remind you that the data contained in this website is not necessarily real-time nor accurate. The data and prices on the website are not necessarily provided by any market or exchange, but may be provided by market makers, and so prices may not be accurate and may differ from the actual price at any given market, meaning prices are indicative and not appropriate for trading purposes. Fusion Media and any provider of the data contained in this website will not accept liability for any loss or damage as a result of your trading, or your reliance on the information contained within this website.
It is prohibited to use, store, reproduce, display, modify, transmit or distribute the data contained in this website without the explicit prior written permission of Fusion Media and/or the data provider. All intellectual property rights are reserved by the providers and/or the exchange providing the data contained in this website.
Fusion Media may be compensated by the advertisers that appear on the website, based on your interaction with the advertisements or advertisers.
© 2007-2025 - Fusion Media Limited. All Rights Reserved.