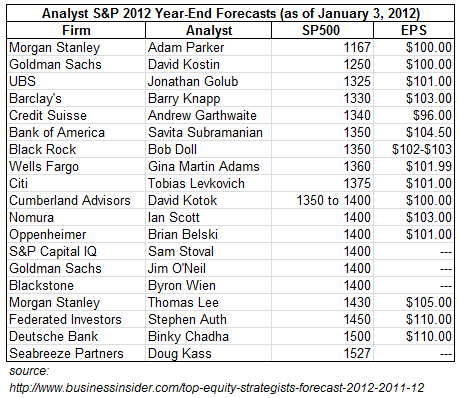
In January of 2012, Barron’s polled many professional analysts for their 2012 S&P 500 price projections. Some have changed their views since then, but let’s use their January forecasts as background for this discussion of volatility implied 2012 year-end price probability ranges.
Professional Forecasts (January 2012):
This is a summary of the professional 2012-12-31 forecasts as of January 2012:
As of this date, Standard and Poor’s is projecting $102 per share earnings for 2012. That’s pretty much where the professionals were back in January, with the exceptions of Morgan Stanley, Federated Investors, and Deutsche Bank, which were high; and the exception of Credit Suisse, which was low.
The bulk of the forecasts were for the index to end 2012 between about 1350 and 1400 (with a low of 1167 and a high of 1527). The index today is at 1410.
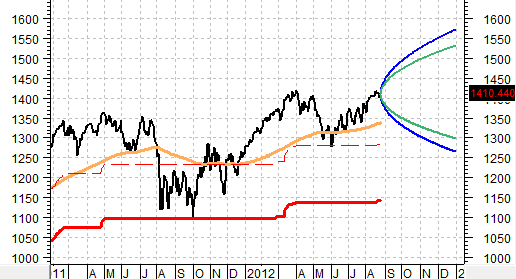
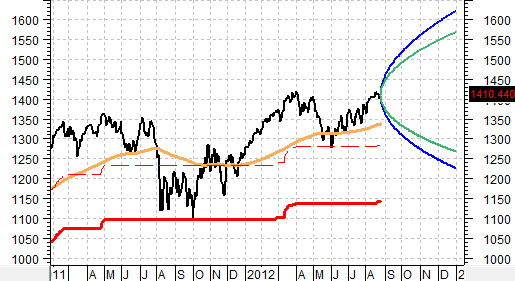
Let’s see what a pure volatility derived guesstimate says. It looks to us like the math suggests a price probability range of between about 1225 and 1575, not terribly different than the range of professional forecasts 8 months ago.
Each chart below plots the price (black), the 200-day exponential moving average (tan), the 10% correction level (dashed red), the 20% bear level (solid red), the price probability range based on 6-month historical volatility (green) and the price probability range based on 1-year historical volatility (blue).
The logic is based on a normal frequency distribution of prices. Reality is more irregular than that, but this is the math that underpins options pricing, and is typically close enough.
80% Probability Based On 1-Year and 6-Month Volatility:
The statistical chance of the price being outside of the probability cone is 10% on either side — 10% higher and 10% lower. Based on 6 months of historical volatility, the 80% probable price range is 1298 to 1534. Based on 1 year of volatility, the 80% probable price range is 1263 to 1577. 
90% Probability Based On 1-Year and 6-Month Volatility:
The statistical chance of the price being outside of the probability cone is 5% on either side — 5% higher and 5% lower. Based on 6 months of historical volatility, the 90% probable price range is 1269 to1569. Based on 1 year of volatility, the 90% probable price range is 1223 to 1628.
Other Relevant Price Level Considerations:
If the price were to fall to the current 200 day average, it would be 1338. If a 10% correction was reached by year-end the price would be 1284. A bear achieved by year-end would produce a price of 1141.
Of course, the price will do what the price will do, and important events like a wider, multi-country war over Syria, going over the US fiscal cliff, and collapse in Spain would throw everything into a cocked hat.
In any event, the combination of professional forecasts, mathematically-derived volatility-based projections, and chart support level indications can serve as reasonable aids to forming your own view.
Earnings forecasts and estimation of valuation multiples are important too (see our blog for historical and projected P/E multiples from Standard and Poor’s, Seeking Alpha for information about historical trends in S&P 500 sales, earnings, dividends, book value and payout ratio).
- English (UK)
- English (India)
- English (Canada)
- English (Australia)
- English (South Africa)
- English (Philippines)
- English (Nigeria)
- Deutsch
- Español (España)
- Español (México)
- Français
- Italiano
- Nederlands
- Português (Portugal)
- Polski
- Português (Brasil)
- Русский
- Türkçe
- العربية
- Ελληνικά
- Svenska
- Suomi
- עברית
- 日本語
- 한국어
- 简体中文
- 繁體中文
- Bahasa Indonesia
- Bahasa Melayu
- ไทย
- Tiếng Việt
- हिंदी
Volatility Implied 2012 Year-End S&P 500 Price Levels
Published 08/28/2012, 04:05 AM
Volatility Implied 2012 Year-End S&P 500 Price Levels
Latest comments
Loading next article…
Install Our App
Risk Disclosure: Trading in financial instruments and/or cryptocurrencies involves high risks including the risk of losing some, or all, of your investment amount, and may not be suitable for all investors. Prices of cryptocurrencies are extremely volatile and may be affected by external factors such as financial, regulatory or political events. Trading on margin increases the financial risks.
Before deciding to trade in financial instrument or cryptocurrencies you should be fully informed of the risks and costs associated with trading the financial markets, carefully consider your investment objectives, level of experience, and risk appetite, and seek professional advice where needed.
Fusion Media would like to remind you that the data contained in this website is not necessarily real-time nor accurate. The data and prices on the website are not necessarily provided by any market or exchange, but may be provided by market makers, and so prices may not be accurate and may differ from the actual price at any given market, meaning prices are indicative and not appropriate for trading purposes. Fusion Media and any provider of the data contained in this website will not accept liability for any loss or damage as a result of your trading, or your reliance on the information contained within this website.
It is prohibited to use, store, reproduce, display, modify, transmit or distribute the data contained in this website without the explicit prior written permission of Fusion Media and/or the data provider. All intellectual property rights are reserved by the providers and/or the exchange providing the data contained in this website.
Fusion Media may be compensated by the advertisers that appear on the website, based on your interaction with the advertisements or advertisers.
© 2007-2025 - Fusion Media Limited. All Rights Reserved.
