Volatility Ebbs For Gold As Consolidation Continues

Published 05/12/2015, 03:10 AM
Updated 07/09/2023, 06:31 AM
DX
-
GC
-
GVZ
-
VIX
-

Gold Daily Chart

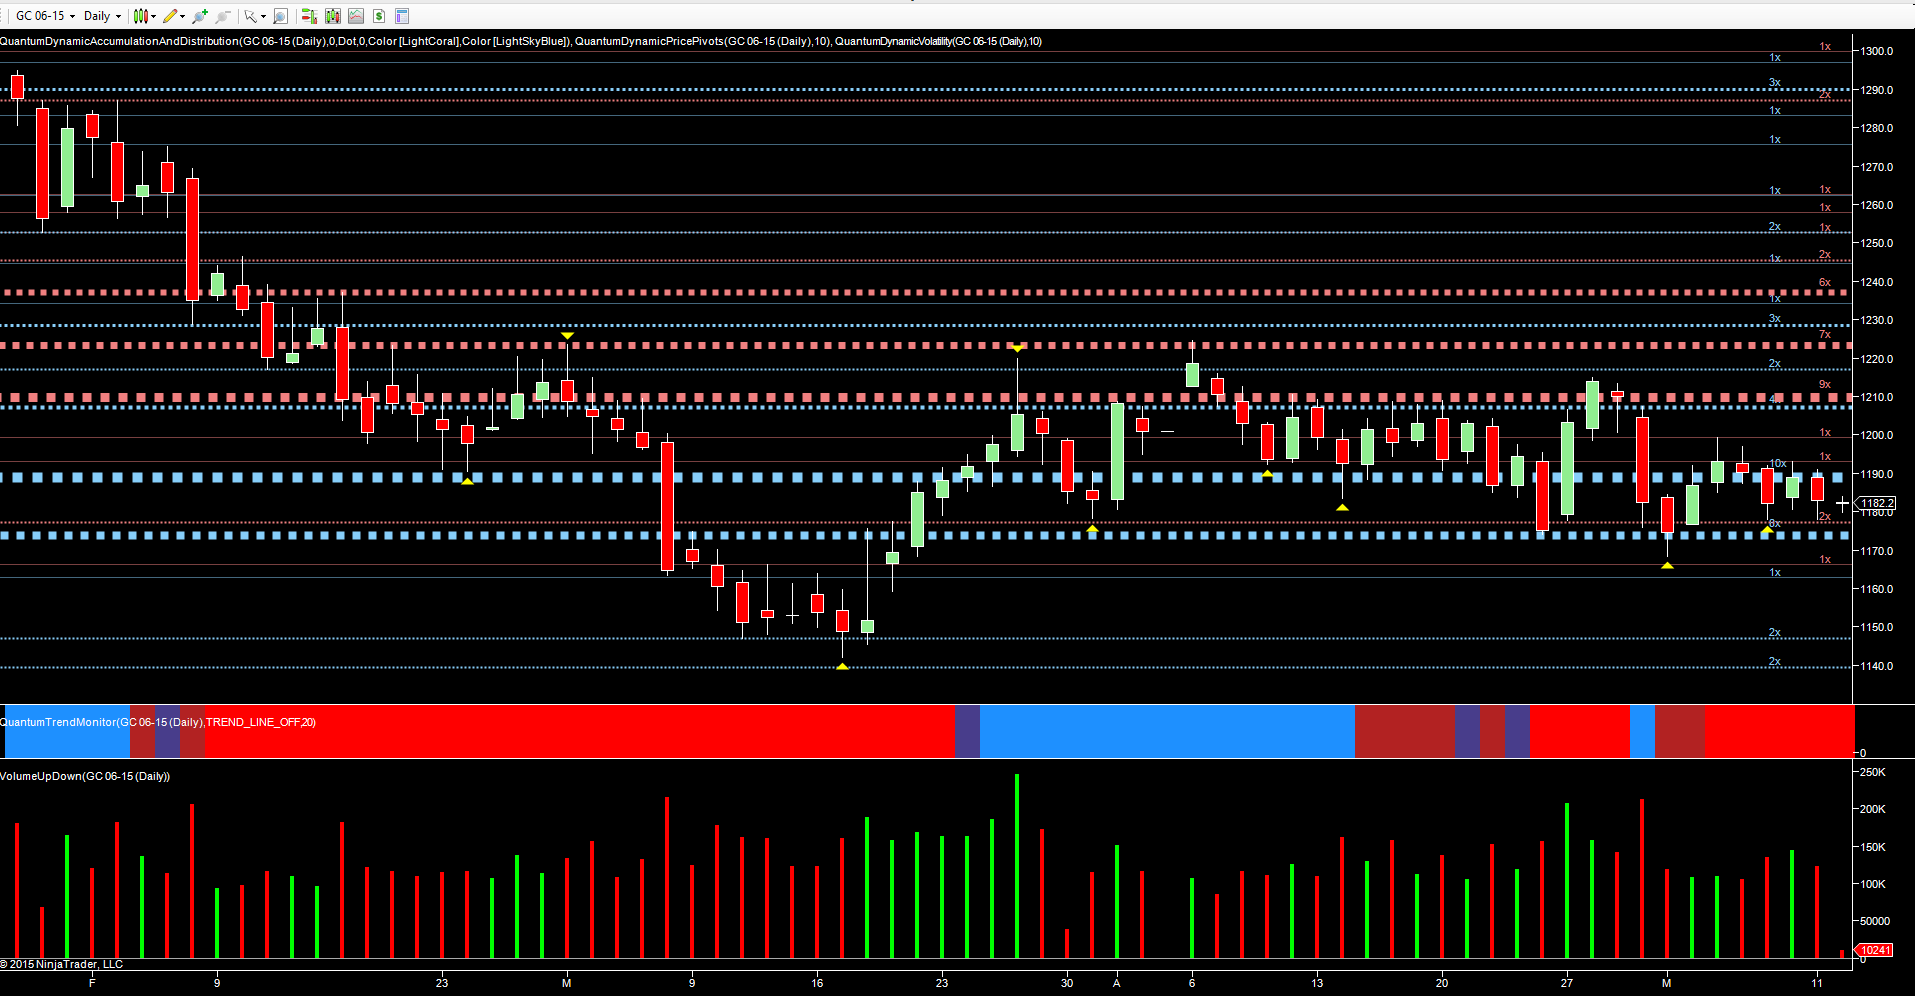
With the US dollar currently in a consolidative phase, gold is also pondering its next move as it continues to trade within a tight range. Volatility has certainly drained away since last week which saw the GVZ index trading around the 18 region. In early trading today the index has fallen sharply to currently trade at 15.85 at time of writing.

As traders, whenever we sense a falling away, or lack of momentum, a quick look at the volatility indices at the CBOE can provide an insight into likely future volatility. In the last two months, we have seen volatility rise steadily from 14.50 to last week’s peak at 18, before declining sharply. Of course, it is always important to remember that volatility on the GVZ is not an indicator for direction, but merely an indication of increasing or decreasing future volatility.
Gold Monthly Chart

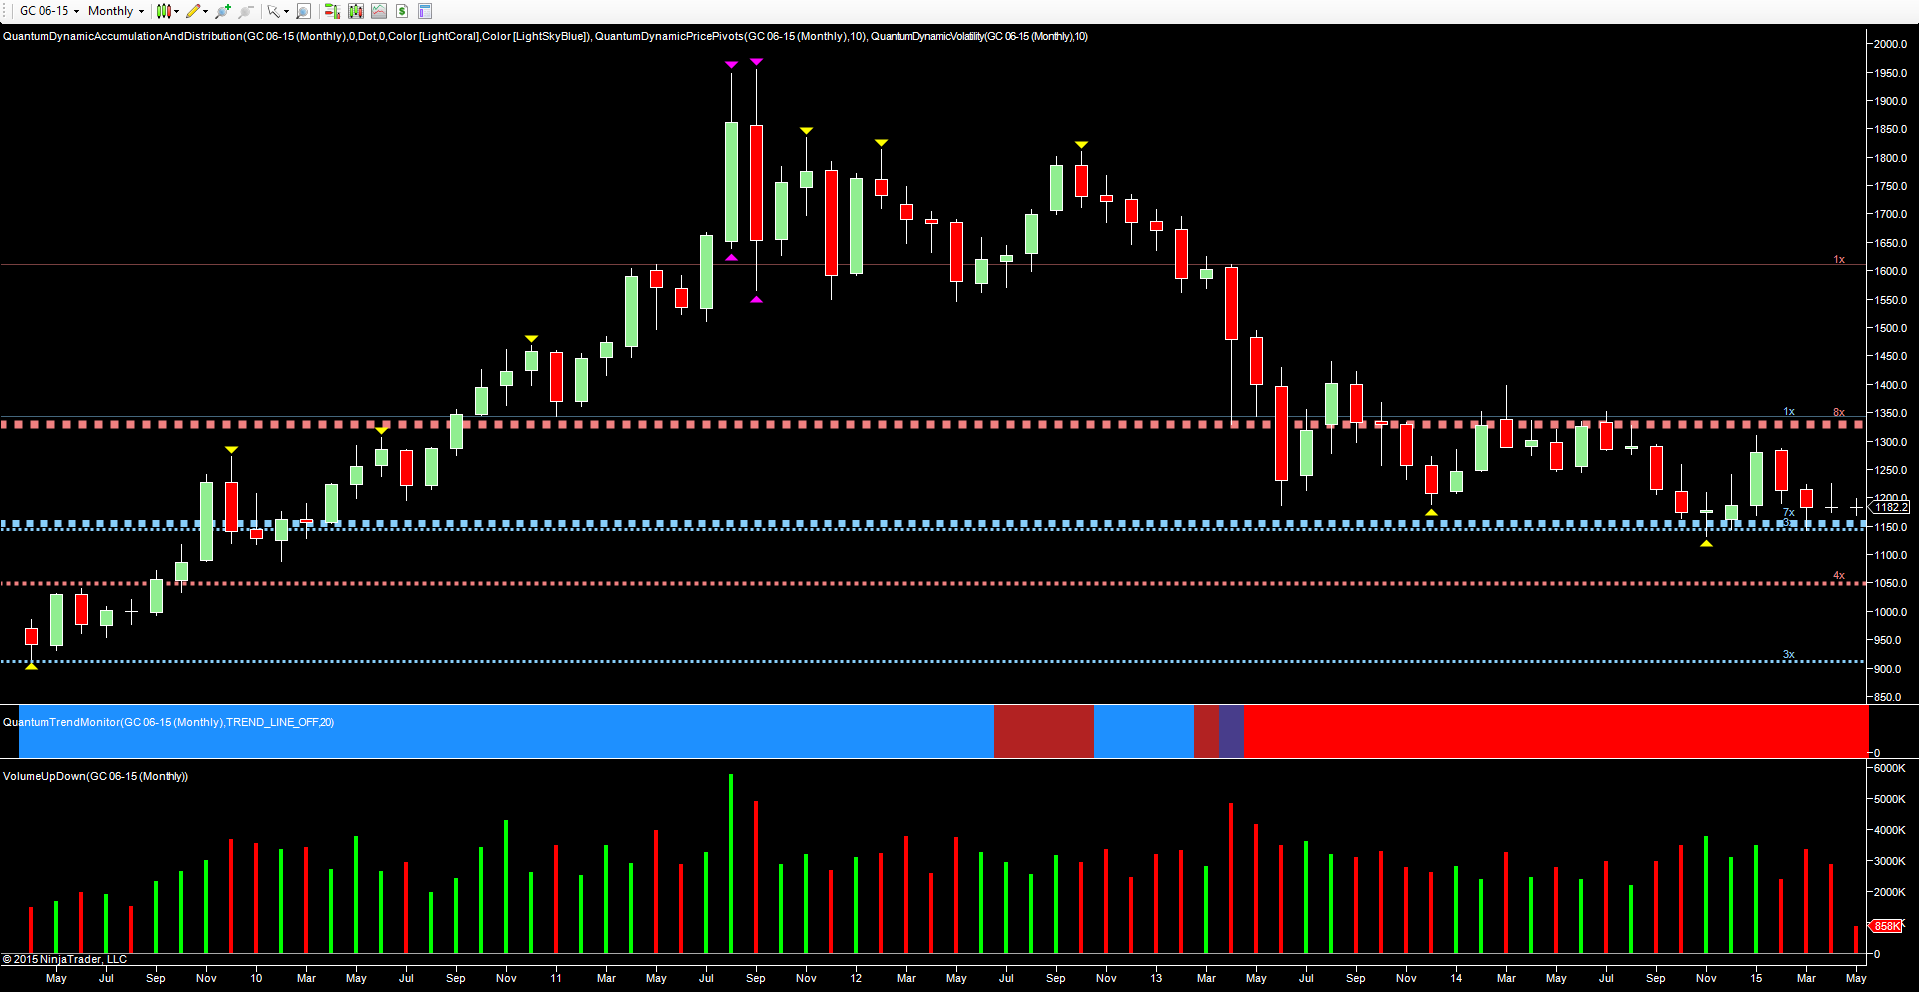
Moving to the monthly chart for gold, the present somewhat moribund price action is clearly in evidence, along with the defined parameters for a sustained move. If gold is to recover, then it has to pierce the ceiling of resistance in place at $1330 per ounce, as denoted by the red dotted line, a strong level of price distribution.

Below, the platform of support continues to hold in a price band which centers around the $1150 per ounce area, as denoted by the two blue lines. This is a key platform in this time frame, and any move through here will then open the way to a test of the next region at $1050 per ounce – the long drop for gold. For gold investors there is little sign of a buying climax in this, or indeed in any other time frame, and with the prospects for inflation becoming increasingly remote, the longer term outlook as an investor looks worrying to say the least. However, this platform of support is holding firm for the time being and may do so again, but the monthly chart really does encapsulate the longer term picture for the precious metal. Any move beyond these two levels will define the longer term trend once more.

Latest comments

Loading next article…
Risk Disclosure: Trading in financial instruments and/or cryptocurrencies involves high risks including the risk of losing some, or all, of your investment amount, and may not be suitable for all investors. Prices of cryptocurrencies are extremely volatile and may be affected by external factors such as financial, regulatory or political events. Trading on margin increases the financial risks.
Before deciding to trade in financial instrument or cryptocurrencies you should be fully informed of the risks and costs associated with trading the financial markets, carefully consider your investment objectives, level of experience, and risk appetite, and seek professional advice where needed.
Fusion Media would like to remind you that the data contained in this website is not necessarily real-time nor accurate. The data and prices on the website are not necessarily provided by any market or exchange, but may be provided by market makers, and so prices may not be accurate and may differ from the actual price at any given market, meaning prices are indicative and not appropriate for trading purposes. Fusion Media and any provider of the data contained in this website will not accept liability for any loss or damage as a result of your trading, or your reliance on the information contained within this website.
It is prohibited to use, store, reproduce, display, modify, transmit or distribute the data contained in this website without the explicit prior written permission of Fusion Media and/or the data provider. All intellectual property rights are reserved by the providers and/or the exchange providing the data contained in this website.
Fusion Media may be compensated by the advertisers that appear on the website, based on your interaction with the advertisements or advertisers.
© 2007-2025 - Fusion Media Limited. All Rights Reserved.