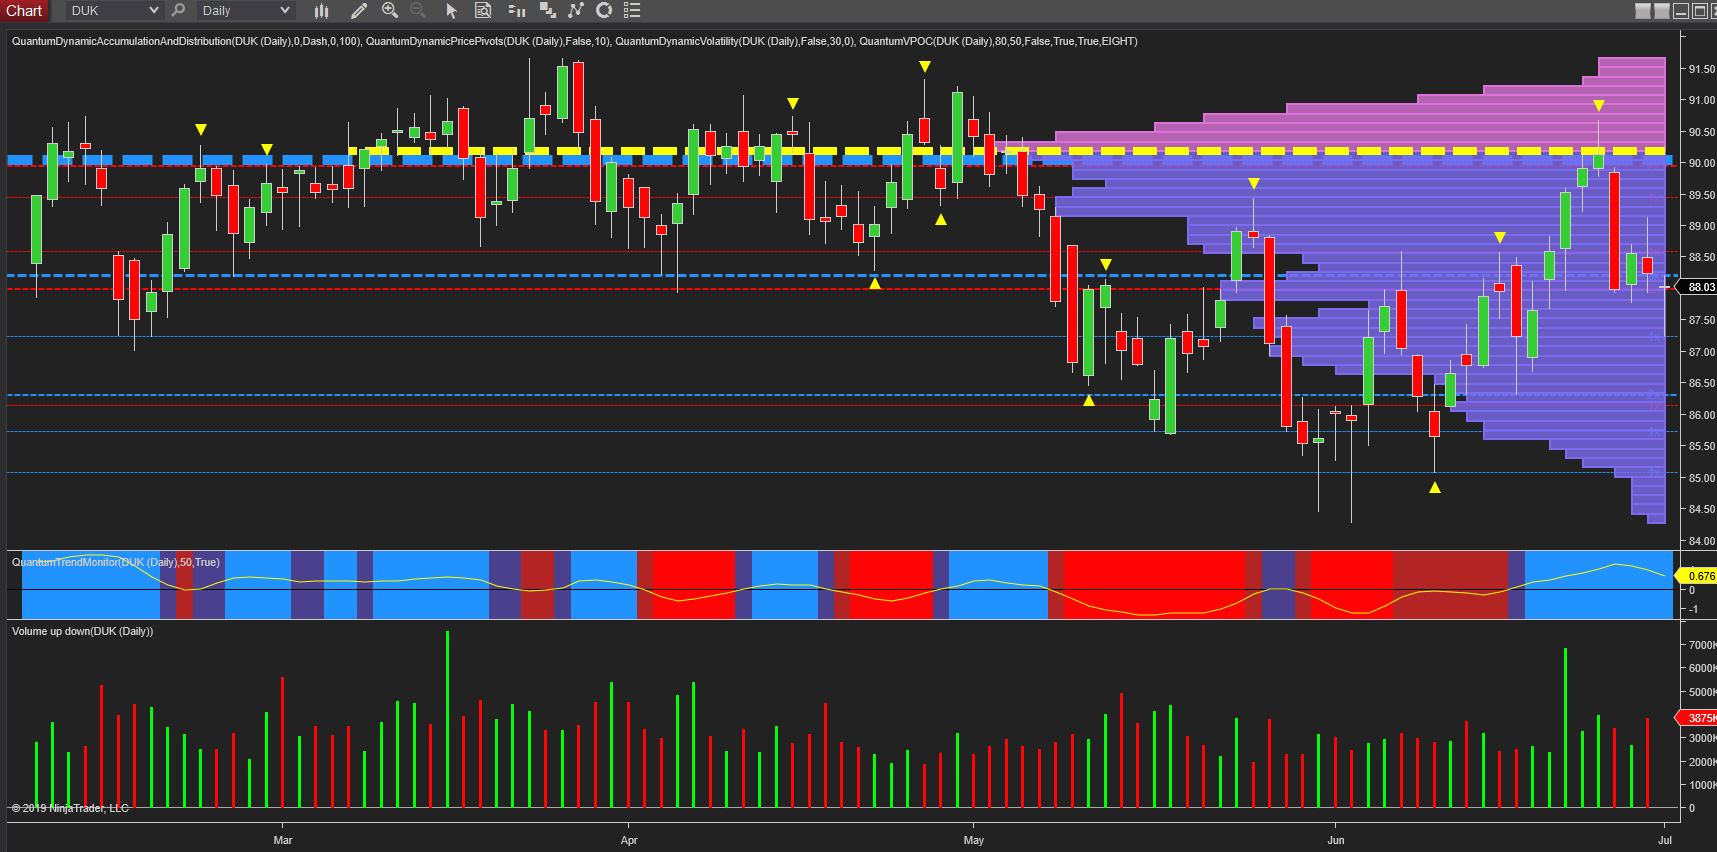
I wrote a post some weeks ago on Duke Energy (NYSE:DUK) and the power of support and resistance and I was reminded of this once again when checking progress for this stock so thought I would add an updated post on this subject, and this time on the daily chart, as opposed to the weekly.
The previous post highlighted the strong level which had developed around the $91 price per share, and which continues to hold firm. Here we have moved to the daily timeframe where we have two significant coincident levels. The first of these is the volume point of control denoted with the yellow dashed line, and the second is the blue dashed line of the accumulation and distribution indicator. One is based on volume and the other on price. The yellow dashed line represents the fulcrum of the market for this stock, in other words, the market is in price agreement. This represents the heaviest transacted volume on the chart, and therefore we expect to see further consolidation and resistance as the stock approaches this region. And the same principle applies to the blue dashed line of the accumulation and distribution indicator, which signals by its width the strength of such of region. Here again, this is a very well developed area, and therefore it was no surprise to see the stock bounce off the $90 area as both levels came into play simultaneously. The good news from a longer term perspective is that once price breaks through and away from this area, a strong trend will develop with excellent areas of support and resistance then coming into play.
