T2108 Status: 48.1%
VIX Status: 18.4
General (Short-term) Trading Call: Short (bearish bias) with caveats (see below)
Active T2108 periods: Day #145 over 20%, Day #30 over 40% (overperiod), Day #1 under 50% (underperiod), Day #6 under 60%, Day #4 under 70%
Commentary
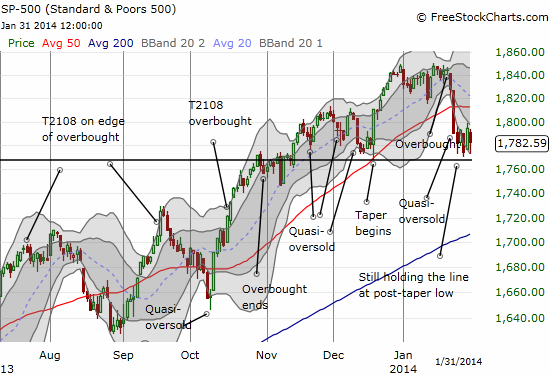
The bears are grumbling louder, but they have yet to kick the door in. The chart below shows a week of sharp churn that managed to stem the bleeding from the previous week. The post-taper low held throughout the week.
This was a week where both bears and bulls alternatively looked smart.
T2108 churned right along with the S&P 500. Other than a quasi-oversold bounce on Tuesday, January 28th, T2108 did not provide much info in this period. It ended the week at 48.1%. The keys to watch are as follows:
- The post-taper low: a close below this apparently critical support will be very bearish.
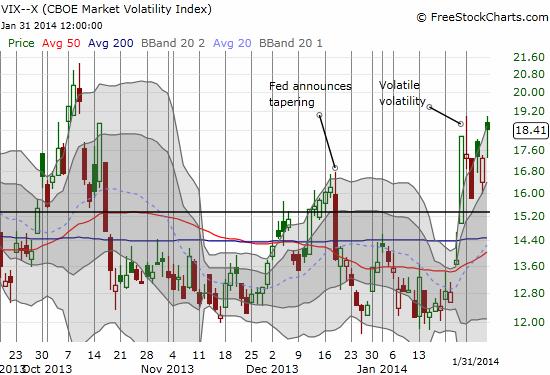
- The VIX: it is proving surprisingly resilient and raising my alarm bells for a a steep slide ahead.
- Speculative stocks: it is hard to imagine a steep decline starting in the market without more of the typical speculative and momentum stocks tumbling as well (see special note on Amazon.com below).
- Currency market: Traders are watching currencies more closely and reacting more quickly. My favorite tell remains AUD/JPY – the Australian dollar (FXA) versus the Japanese yen (FXY).
My fundamental bias remains bearish, but it is a “soft” bearishness that tells me to fade the market on a relief rally into overhead 50DMA resistance. I am NOT bearish because I expect the critical post-taper support to give way imminently. I am waiting to see the market’s behavior after a bounce.
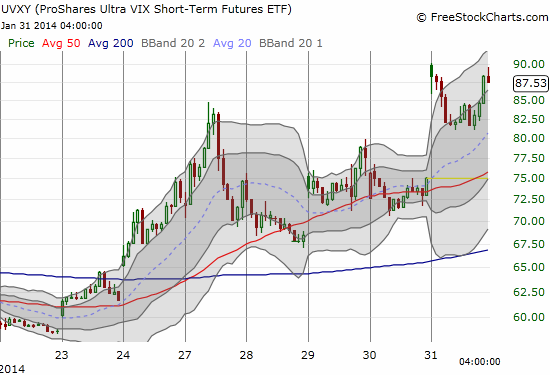
Alternatively, you COULD consider me cautiously bullish since I spent the week fading volatility. I was successful after the first round, but my second round of fades did not sustain their gains. In fact, volatility itself has become volatile with the VIX able to bounce back from every attempt to squash it. See below the chart of the volatility index, the VIX, and an intraday chart of ProShares Ultra VIX Short-Term Futures ETF (UVXY).
This rare resilience for volatility is a brightening red flag that more downside may come before a relief rally.
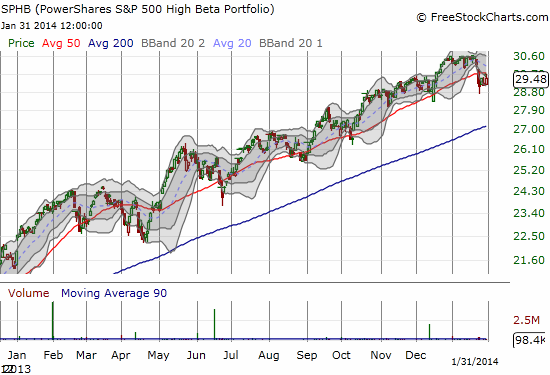
Many speculative and momentum stocks fared just fine this week. If more downside were imminent, I would have expected more of these momentum specials to demonstrate weakness. A good example of the resilience of speculation is PowerShares S&P 500 High Beta (SPHB). This index of highly volatile stocks is still below its 50DMA, but it finished the week well off the lows of the week.
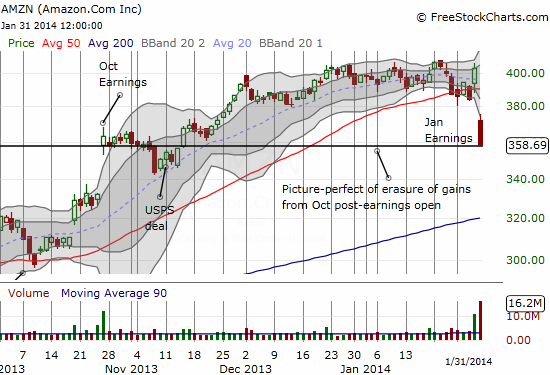
One VERY notable exception this week was Amazon.com (AMZN). Sellers made a rare statement in this expensive stock, taking it down 11% and essentially closing it out at the low of the day. Typically, buyers step in post-earnings to deliver a quick bounce. Not this time. I executed my typical buy the open strategy, took quick profits, got greedy, plowed those profits in a new position as the stock sank, and am in the red because of it. Note the poetry in the chart with the close right at the open of October earnings – fourth quarter post-earnings profits erased in one big day. Note also that AMZN provided a rare case where fading a stock moving well beyond its Bollinger Band (BB) did NOT work – this command of the sellers is a particularly bearish sign here.
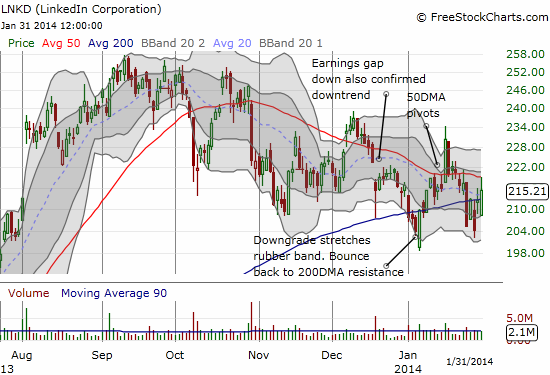
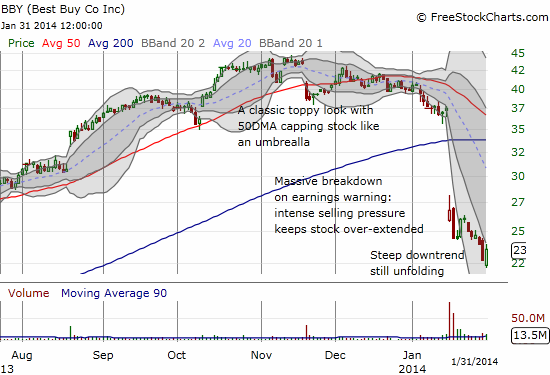
Now, some final charts: LinkedIn (LNKD), Best Buy (BBY), and Netflix (NFLX).
LNKD continues to pivot around its 200DMA. After missing my opportunity for nice profits on Monday, I eagerly locked up this trade near the end of Wednesday’s swoon (if only such patience paid off all the time!). Just in time too! I re-entered a small short on Thursday’s surge into the 200DMA. Note how the 50DMA pivot failed LNKD for a third time during the current downtrend (matching my earlier expectations).
BBY continues to slide. The stabilization I was looking for has yet to materialize. Thursday was particularly brutal as retail stocks across the board took big hits.
Finally, NFLX is proving even more bullish than I expected. After two successful quick trades, I ended up unprepared to ride NFLX to fresh all-time highs. As I wrote earlier, NFLX looks ready for a fresh upswing.
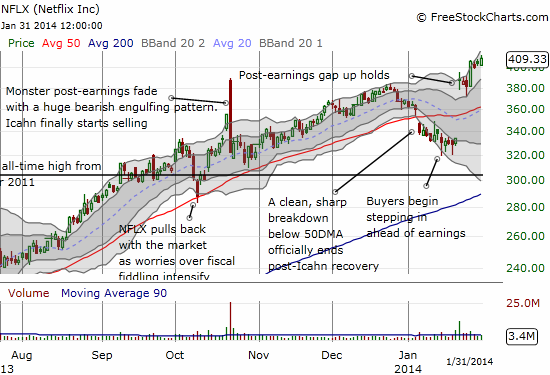
New all-time highs for Netflix. What bearish grumbling?
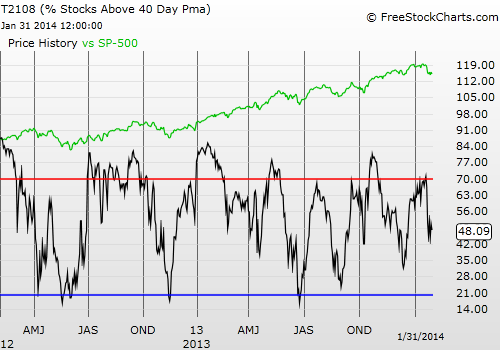
Black line: T2108 (measured on the right); Green line: S&P 500 (for comparative purposes)
Red line: T2108 Overbought (70%); Blue line: T2108 Oversold (20%)
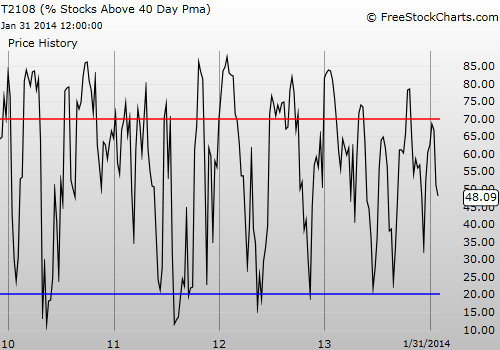
Be careful out there!
Full disclosure: long SPHB and SPLV and SSO puts; long VXX shares and puts; long UVXY put; long AUD/JPY; long AMZN shares and calls; short BBY put and long BBY call spread

