Netflix, Inc. (NFLX), incorporated on August 29, 1997, is an Internet subscription service streaming television shows and movies. The Company’s subscribers can watch unlimited television shows and movies streamed over the Internet to their televisions, computers and mobile devices, and in the United States, subscribers can also receive digital versatile discs (DVDs) delivered to their homes.
I found this stock using a real-time custom scan. This one hunts for depressed vols. After doing a number of articles on elevated vol, I find this a very compelling story on depressed vol given the incredibly high realized vol of late.
Custom Scan Details
Stock Price GTE $5
IV30™ GTE 20
IV30™ Percentile LTE 10
Average Option Volume GTE 1,200
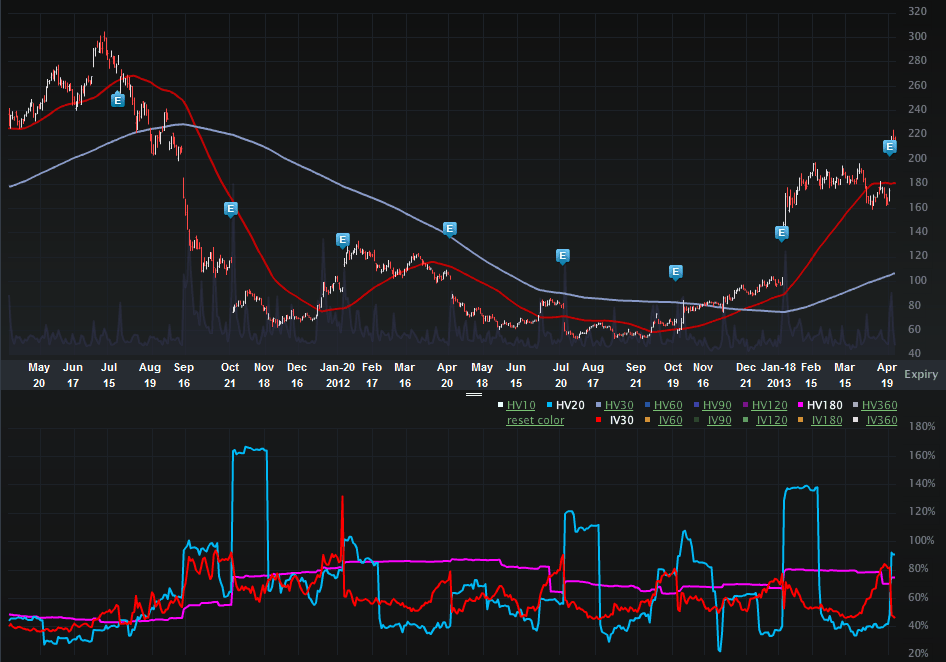
The two-year NFLX Charts Tab is included (below). The top portion is the stock price the bottom is the vol (IV30™ - red vs HV20™ - blue vs HV180™ - pink).

We can see the wild ride in NFLX stock over the last two-years, but really it’s been a five-year ride. A lot of respect has to be levied at the feet of NFLX management for doing such a stellar job of pulling the firm out of what looked to be a hopeless situation just a few months ago. And, on a personal note (and as a professional screenwriter), “House of Cards” was absolutely brilliantly done – an in-house NFLX production which has fired a shot back across the bow of the largest content distributors in Hollywood (Sony, Disney, Paramount, Warner Bros, Lions Gate, Fox, NBCUniversal).
NFLX has taken on the industry big boys… again…
I wonder if in a few years, the next time we discuss the most powerful distributors in Hollywood, if NFLX is on the list... at the top.
If we look at the last two earnings cycles (blue “E” icons), we can see the abrupt gaps up on the news – when NFLX reported better than expected results (by a lot).
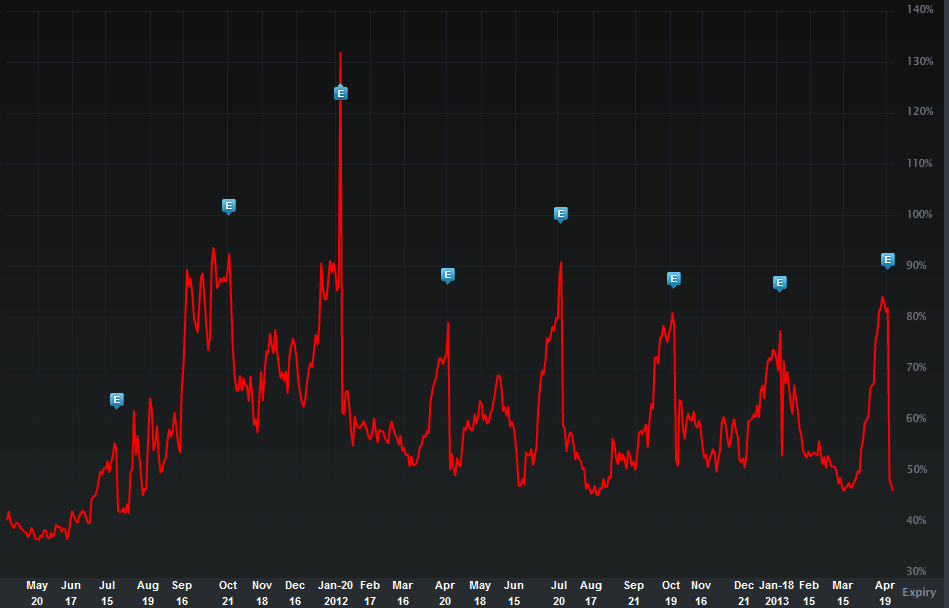
But, this is a vol note, so let’s look to the two-year IV30™ chart in isolation.

We can see the implied as of today is just above an annual low and quite close to multi-year lows. The vol crush off of earnings is normal and expected. What I do find odd, in this case specifically, is how low the implied has gone after a 25% move up on earnings just a few days ago. Looking to the vol comps, we can see quite a divergence between the implied (forward looking vol) and historical vols.
IV30™: 46%
HV10™: 118% (all earnings based)
Hv20™: 91 (mostly earnings based)
HV30™: 78% (somewhat earnings based)
HV90™: 83%
It’s that HV90™ number that really catches my eye. HV90™ is the realized volatility over the last 90 trading days (which is more than four months). So, the stock has moved at an 83% annual clip over the last four months, but the IV30™ (the option market’s forward looking projection for the next 30 days) is considerably lower. Hmmm….
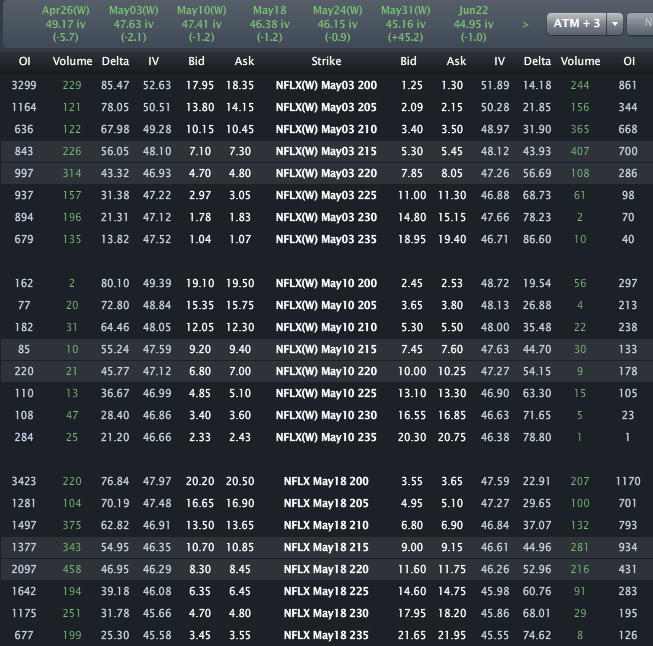
Finally, let's look to the Options Tab (below).

Across the top we can see the monthly vols are priced to 46.38% in May and 44.95% in June. Both feel low… right?
Disclosure: This is trade analysis, not a recommendation.
Images provided by Livevol®
I found this stock using a real-time custom scan. This one hunts for depressed vols. After doing a number of articles on elevated vol, I find this a very compelling story on depressed vol given the incredibly high realized vol of late.
Custom Scan Details
Stock Price GTE $5
IV30™ GTE 20
IV30™ Percentile LTE 10
Average Option Volume GTE 1,200
The two-year NFLX Charts Tab is included (below). The top portion is the stock price the bottom is the vol (IV30™ - red vs HV20™ - blue vs HV180™ - pink).

We can see the wild ride in NFLX stock over the last two-years, but really it’s been a five-year ride. A lot of respect has to be levied at the feet of NFLX management for doing such a stellar job of pulling the firm out of what looked to be a hopeless situation just a few months ago. And, on a personal note (and as a professional screenwriter), “House of Cards” was absolutely brilliantly done – an in-house NFLX production which has fired a shot back across the bow of the largest content distributors in Hollywood (Sony, Disney, Paramount, Warner Bros, Lions Gate, Fox, NBCUniversal).
NFLX has taken on the industry big boys… again…
I wonder if in a few years, the next time we discuss the most powerful distributors in Hollywood, if NFLX is on the list... at the top.
If we look at the last two earnings cycles (blue “E” icons), we can see the abrupt gaps up on the news – when NFLX reported better than expected results (by a lot).
But, this is a vol note, so let’s look to the two-year IV30™ chart in isolation.

We can see the implied as of today is just above an annual low and quite close to multi-year lows. The vol crush off of earnings is normal and expected. What I do find odd, in this case specifically, is how low the implied has gone after a 25% move up on earnings just a few days ago. Looking to the vol comps, we can see quite a divergence between the implied (forward looking vol) and historical vols.
IV30™: 46%
HV10™: 118% (all earnings based)
Hv20™: 91 (mostly earnings based)
HV30™: 78% (somewhat earnings based)
HV90™: 83%
It’s that HV90™ number that really catches my eye. HV90™ is the realized volatility over the last 90 trading days (which is more than four months). So, the stock has moved at an 83% annual clip over the last four months, but the IV30™ (the option market’s forward looking projection for the next 30 days) is considerably lower. Hmmm….
Finally, let's look to the Options Tab (below).

Across the top we can see the monthly vols are priced to 46.38% in May and 44.95% in June. Both feel low… right?
Disclosure: This is trade analysis, not a recommendation.
Images provided by Livevol®
