- Revised Eurozone Manufacturing PMI data may support an upbeat outlook for Q2
- Another month of growth is expected in the US ISM Manufacturing Index for April
- Sluggish consumer spending contributed to slow GDP growth in the US in Q1
- There's room for debate over whether GBP/USD rally is likely to roll on this week
- Some see the rally as just a pause in the GBP/USD bear trend
The first trading day of May kicks off with new sentiment data on manufacturing in several countries for April. Today's updates for purchasing managers’ indexes include revised figures for the Eurozone. We’ll also see the first run of April data for the US ISM Manufacturing Index. Meantime, keep an eye on GBP/USD, which has enjoyed a strong rally in recent weeks. Is this the start of a new bull market for sterling—or another bear-market bounce in a long-running downtrend?
Eurozone: Manufacturing PMI (0800 GMT) Economic growth in the Eurozone was surprisingly strong in this year’s first quarter, according to Friday’s flash estimate for GDP from Eurostat. Output jumped 0.6% in the first three months of 2016 vs. the previous quarter. The increase marks the biggest advance in a year. Is this a sign that growth is set to accelerate for the euro area? Maybe, but there are several reasons to reserve judgment at the moment.
The first official flash GDP estimate via Eurostat is missing several key pieces: output from Germany and Italy, which wasn’t available as of Friday’s Eurozone release. Even if the Q1 data holds up in the revisions to come, other data sources raise the possibility that the trend may slow in Q2.
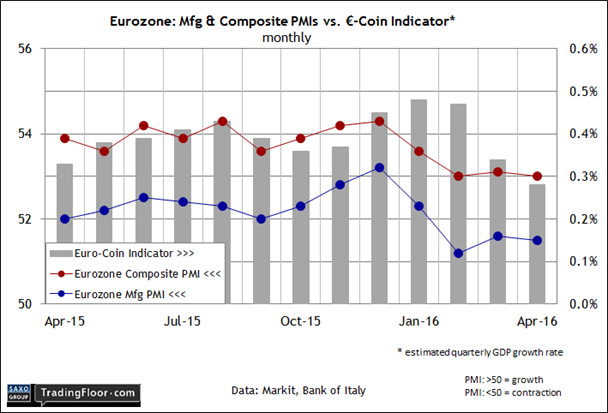
For instance, the Bank of Italy’s Euro-Coin Indicator—a monthly estimate of Eurozone GDP quarterly growth—slipped to just 0.28% in April, based on the report published on Friday. That’s nearly half the pace in January and February. Meanwhile, Now-casting.com’s Q1 GDP estimate for the Eurozone was slightly below the 0.4% mark for the quarter-over-quarter rate via the April 22 estimate, roughly in line with current projection for Q2.
In addition, the initial estimate of the Eurozone Composite PMI for April is signalling GDP growth for the currency area of 0.3%. “A failure of business expectations to revive following the ECB’s announcement of more aggressive stimulus in March is a major disappointment and suggests that the modest pace of growth is unlikely to accelerate in coming months,” Markit’s chief economist said two weeks ago.
Today’s revised data for the Eurozone Manufacturing PMI for April will provide more context for evaluating the outlook for the macro trend in Q2. The flash data showed that manufacturing sentiment eased to a two-month low: 51.5. That’s above the neutral 50 mark, but it’s a sluggish growth rate. If today’s revised figure for April eases further, the outlook for Q2 growth will tick lower too.

US: ISM Manufacturing Index (1400 GMT) In contrast with the Eurozone, last week’s first quarter GDP report for the US was surprisingly weak, raising new questions about the economic outlook. Output slowed to a crawl—just 0.5% (seasonally adjusted annual rate), the slowest in two years. A key headwind: sluggish consumer spending, despite the fact that disposable personal income growth picked up.
The corporate sector was a major drag on GDP too. Business spending (nonresidential fixed investment) fell by an annualized 5.9% rate in Q1—the biggest tumble since the last recession.
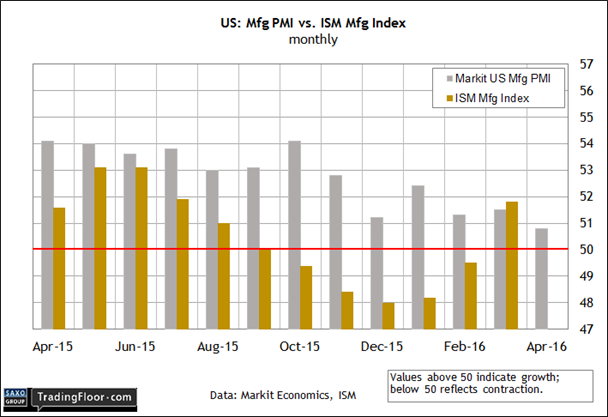
The big mystery is whether the stall-speed growth in Q1 will carry over into Q2. Manufacturing is only one piece of the puzzle, but a useful one nonetheless, in part because the data arrives relatively early via sentiment metrics. On that note, the flash data for US manufacturing via Markit’s PMI report April points to more weakness. “US factories reported their worst month for just over six-and-a-half years in April, dashing hopes that first quarter weakness will prove temporary,” Markit’s chief economist said last month.
The competing numbers via the ISM Manufacturing Index in March hint at a firmer trend. This benchmark rebounded to a positive reading (above the neutral 50 mark) in March for the first time in seven months. Will today’s April update reveal another round of manufacturing growth? Yes, according to MarketWatch.com’s consensus forecast, which sees the ISM index ticking slightly lower to 51.5. But that’s still comfortably above the neutral 50 mark.
For additional context, take a look at the revised April data for the PMI, which is also due for an update today at 1345 GMT. If both benchmarks hold on to growth readings for last month, the news will keep hope alive that the weak Q1 GDP report may be just a temporary affair rather than the start of deeper woes for the US economy. The week's key release awaits in Friday’s employment report for April. Today’s numbers, however, may provide a prelude of things to come.

GBP/USD In a TradingFloor.com column last week, Andreas Clenow, ACIES Asset Management CIO, warned that the recent rally in the pound is “unlikely to last.” (please see sterling rally unlikely to last). Clenow reasoned that the weak trend over the last two years is probably still in play. “All indications are that we're simply seeing a pause in the bear trend.”
Clenow is an authority on market trends (his book Following the Trend is a tour de force on the subject) and so his analyses aren't easily dismissed. But crowd psychology can still surprise even the savviest analyst. The question, then, is whether GBP/USD is in the process of breaking its bearish trend that's been underway since 2014.
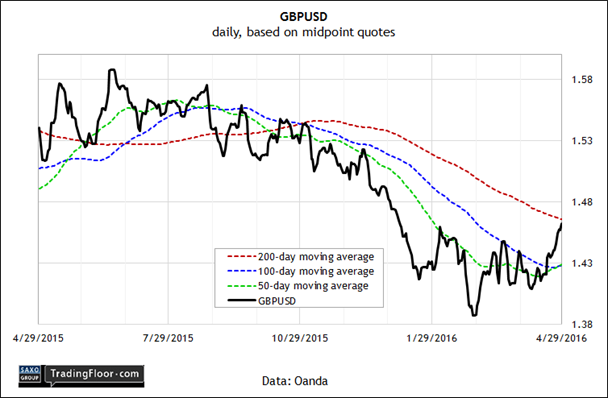
Recent history leaves room for debate. Indeed, sterling’s rally since late February has carried GBP/USD up to roughly 1.46. In addition, note that a simple 50-day moving average of the GBP/USD (based on daily midpoint quotes) has ticked ever so slightly above the 100-day average for the first time since last September.
Clearly, the pound’s bullish U-turn of late enjoys a fair amount of momentum. But can it last? The week ahead may drop new clues. Key variables for deciding what’s coming include how the 50-day average fares—in particular, will it move decisively above the 100-day average and hold above that? This week's PMI data for Britain's manufacturing (due out on Tuesday) and services (to be released on Thursday) sectors will be factors too.
There’s no shortage of jokers in the deck, including the June 23 Brexit vote, which will decide if Britain stays in the European Union. There’s a growing consensus among economists that leaving European club will inflict a hefty price tag on the UK economy. In other words, a GBP/USD rally from current levels may become increasingly treacherous, depending on the Brexit headlines in the weeks ahead.
In any case, sterling’s rally looks impressive at the moment. That’s not the same thing as concluding that Clenow’s forecast is wrong, at least not yet. But bouncing off February's multi-year bottom is one thing. Declaring that GBP/USD’s entered a new bull market is something else entirely. Nonetheless, it’s premature to rule out a new installment of regime shift just yet.

Disclosure: Originally published at Saxo Bank TradingFloor.com
