The VIX measures the implied volatility of the S&P 500 and is often referred to as the “Fear Index.” I found VIX using the real-time custom scan that hunts for depressed vols. But there’s more to this story… A lot more…
I’ll start this off with my concluding question:
“Does the S&P 500 have less risk now than it has at any point in the last two-years and even if so, is the probability of that low risk maintaining its current level higher than it has been at any point in the last two years?”
Custom Scan Details
Stock Price GTE $5
IV30™ GTE 20
IV30™ Percentile LTE 10
Average Option Volume GTE 1,200
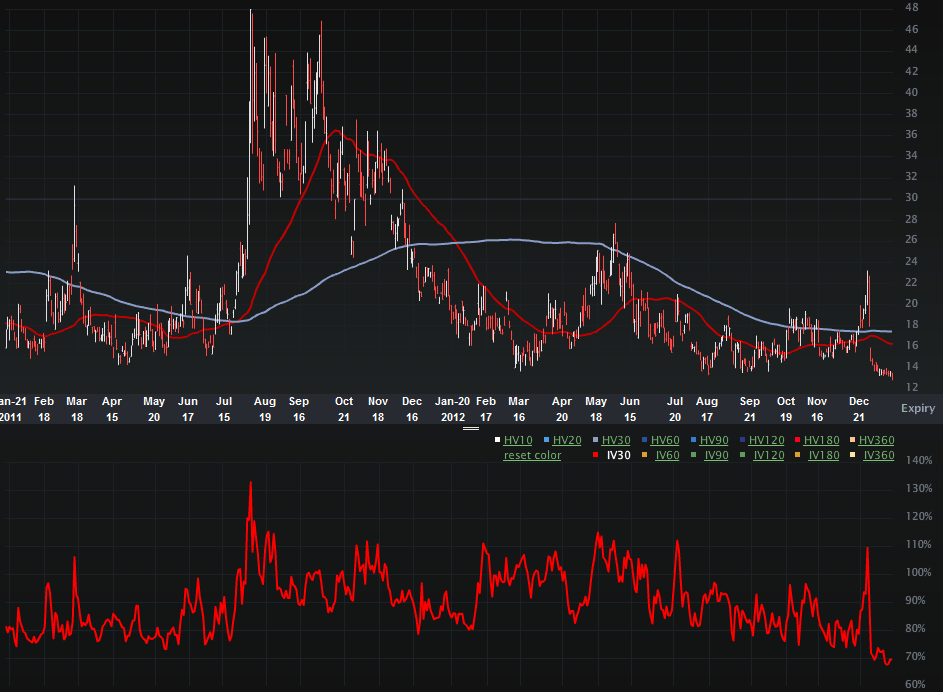
The VIX two-year Charts Tab is included (below). The top portion is the spot price the bottom is the vol (IV30™).
We can see that the spot is now trading at a multi-year low. Through all the fiscal cliff, political battles, Eurozone “whatever”, Chinese fraud epidemic and everything else, the S&P 500 volatility index is at a multi-year low. But there’s more…
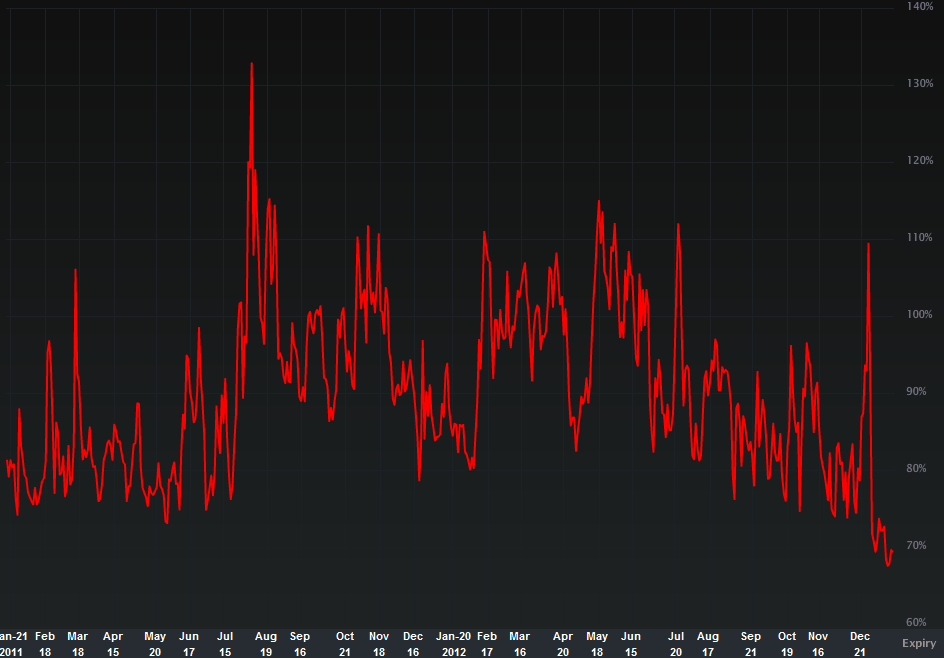
I have included a two-year chart of the VIX IV30™ - the vol of the vol (the fear of the fear), below.
We can see that not only is the VIX spot itself at multi-year lows, but the IV30™ is also at a multi-year low. In other words, the “fear index” is at a low and the “fear that the fear” could change from here is also at a low.
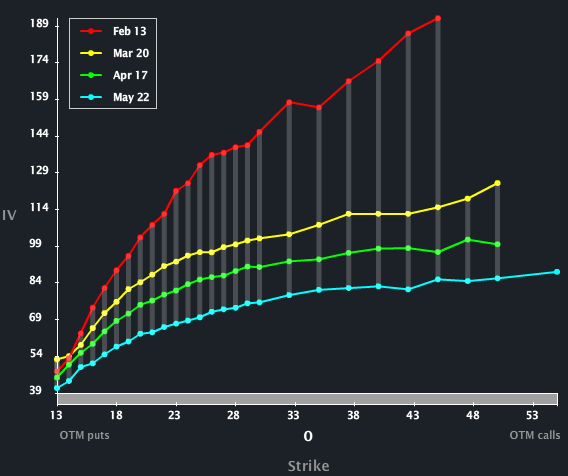
Believe it or not, there’s more to this story… Let’s turn to the Skew Tab.
We can see that the monthly vols monotonically decrease from the front to the back. In English, the option market reflects that the perceived fear of the fear index moving is lessening with time. That is, the multi-year lows will continue to be breached and trend lower.
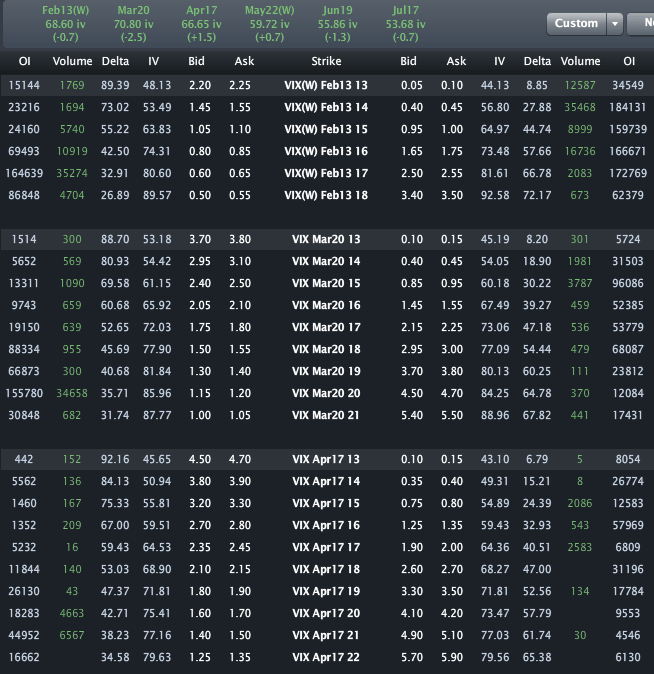
Finally, let's look to the Options Tab (below).
Across the top we can see the monthly vols for the VIX are priced to 70.80%, 66.65% and 55.86% for Mar, Apr and Jun, respectively. Just take a moment to reflect on that Jun vol… The 52 wk range in IV30™ of the VIX is [67.57%, 114.89%], so again, a new low Friday. But 55.86% (Jun vol) is substantially lower than even these multi-year lows.
The bottom line is, without expressing opinion, the facts of the option market reflect that the VIX itself is at multi- year lows and the probability that the VIX moves away from these levels is at its lowest level in multiple years. Taken a step further, the forward looking option market reflects that the risk of a change in VIX is even lower.
It’s not my place to question the “market” but ask yourself this: “Does the S&P 500 have less risk now than it has at any point in the last two-years and even if so, is the probability of that low risk maintaining its current level higher than it has been at any point in the last two years?”
Disclosure: This is trade analysis, not a recommendation.
Images provided by Livevol®
- English (UK)
- English (India)
- English (Canada)
- English (Australia)
- English (South Africa)
- English (Philippines)
- English (Nigeria)
- Deutsch
- Español (España)
- Español (México)
- Français
- Italiano
- Nederlands
- Português (Portugal)
- Polski
- Português (Brasil)
- Русский
- Türkçe
- العربية
- Ελληνικά
- Svenska
- Suomi
- עברית
- 日本語
- 한국어
- 简体中文
- 繁體中文
- Bahasa Indonesia
- Bahasa Melayu
- ไทย
- Tiếng Việt
- हिंदी
VIX At Multi-Year Lows; Low Probability Fear Will Return Statistics Say
Published 01/20/2013, 01:34 AM
Updated 07/09/2023, 06:31 AM
VIX At Multi-Year Lows; Low Probability Fear Will Return Statistics Say
Latest comments
Loading next article…
Install Our App
Risk Disclosure: Trading in financial instruments and/or cryptocurrencies involves high risks including the risk of losing some, or all, of your investment amount, and may not be suitable for all investors. Prices of cryptocurrencies are extremely volatile and may be affected by external factors such as financial, regulatory or political events. Trading on margin increases the financial risks.
Before deciding to trade in financial instrument or cryptocurrencies you should be fully informed of the risks and costs associated with trading the financial markets, carefully consider your investment objectives, level of experience, and risk appetite, and seek professional advice where needed.
Fusion Media would like to remind you that the data contained in this website is not necessarily real-time nor accurate. The data and prices on the website are not necessarily provided by any market or exchange, but may be provided by market makers, and so prices may not be accurate and may differ from the actual price at any given market, meaning prices are indicative and not appropriate for trading purposes. Fusion Media and any provider of the data contained in this website will not accept liability for any loss or damage as a result of your trading, or your reliance on the information contained within this website.
It is prohibited to use, store, reproduce, display, modify, transmit or distribute the data contained in this website without the explicit prior written permission of Fusion Media and/or the data provider. All intellectual property rights are reserved by the providers and/or the exchange providing the data contained in this website.
Fusion Media may be compensated by the advertisers that appear on the website, based on your interaction with the advertisements or advertisers.
© 2007-2025 - Fusion Media Limited. All Rights Reserved.
