VirnetX Holding Corporation (VHC) is engaged in the business of commercializing a portfolio of patents. The Company develops software and technology solutions for securing real-time communications over the Internet.
Something is coming in the next five days, or so says the options market.
This is an awesome calendar spread story with just five trading days to go in this expiry. Without even reading the news the option market reflects huge risk in the next five days, which in option speak means, vol is extremely elevated in Mar relative to Apr. The business of patents and patent portfolios exists in a wonderful world of uncertainty and in many ways, a magical (but real) promise of greatness.
I found VHC using the real-time custom scan that hunts for calendar spreads between the front two monthly expiries.
Custom Scan Details
Stock Price GTE $5
Sigma1 - Sigma2 GTE 7
IV30™ GTE 30
Average Option Volume GTE 1,200
The goal with this scan is to identify back months that are cheaper than the front by at least 10 vol points. I'm also looking for a reasonable amount of liquidity in the options (thus the minimum average option volume) and enough strikes to spread and thus a minimum stock price. I also require a minimum vol level in order to avoid any boring ETFs (or whatever).
Let’s start with the Skew Tab to examine the month-to-month and line-by-line vols.

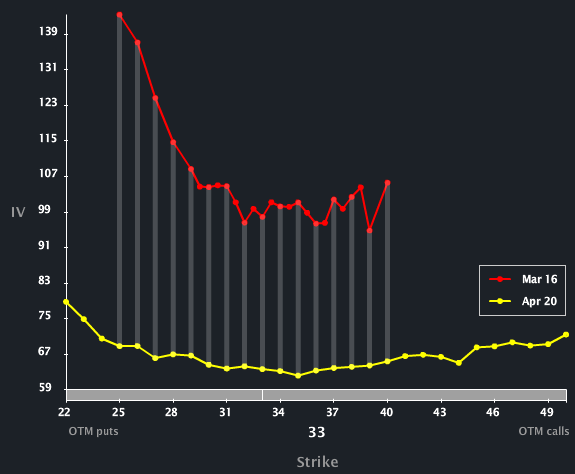
We can see how elevated Mar is to Apr as well as how flat Apr skew appears when compared to Mar. If you peak at the vertical axis you can see how large the vol diff is – on the downside we’re looking at nearly 2x vol in Mar to Apr. When we look at the Charts Tab, we’ll see why…
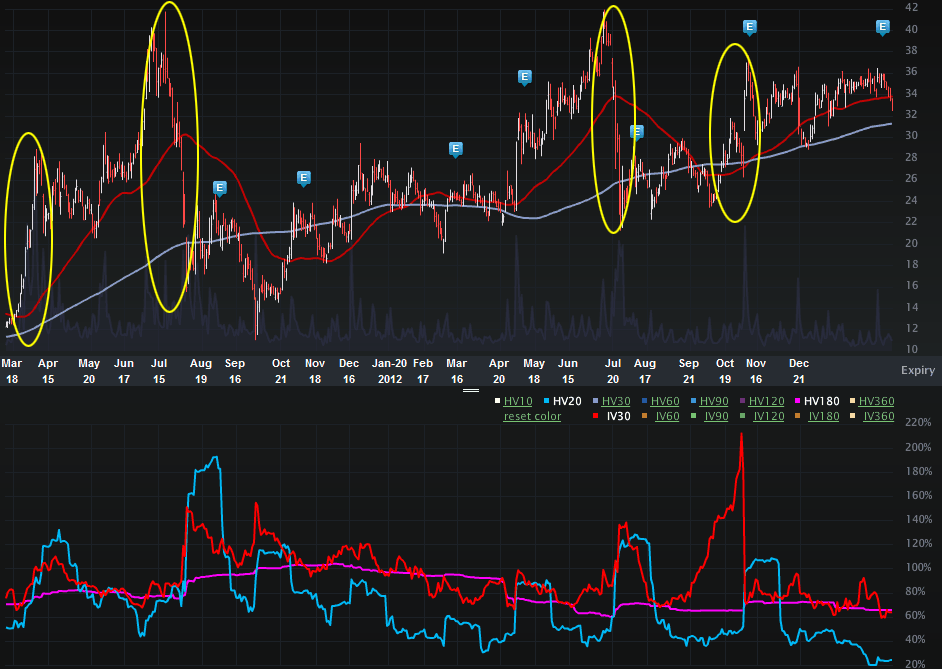
The two-year VHC Charts Tab is included (below). The top portion is the stock price the bottom is the vol (IV30™ - red vs HV20™ - blue vs HV180™ - pink).

On the stock side we can see some absolutely enormous stock moves in short bursts of time. The stock more than doubled in that first highlighted are, then was cut by more than 50% in the next highlighted area. All told, this stock has been as low as $11.01 and as high as $41.93 in just two years.
On the vol side we can see the explosion into the earnings cycle in Nov of 2012, when IV30™ hit as high as 212%. Whoa…
Finally, let's look to the Options Tab (below).

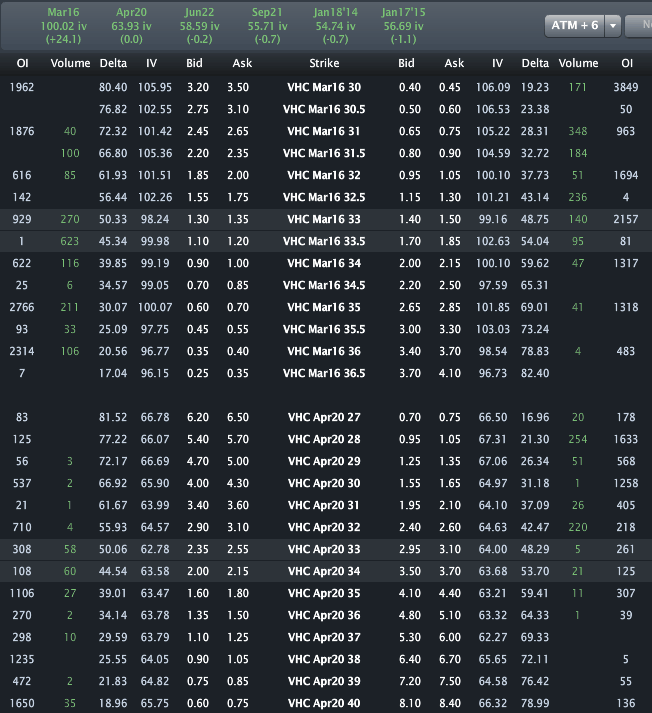
Across the top we can see that Mar vol is priced to 100.02% while Apr vol is priced to 63.93%, so about a 36 vol point diff. But look at some specific strikes. The Mar/Apr 30 put spread shows a ~40 point vol diff, and though not pictured here, the Mar/Apr 27 vol diff sows a 60 point vol diff.
Something is coming in the next five days, or so says the option market.
Disclosure: This is trade analysis, not a recommendation.
Images provided by Livevol®
Something is coming in the next five days, or so says the options market.
This is an awesome calendar spread story with just five trading days to go in this expiry. Without even reading the news the option market reflects huge risk in the next five days, which in option speak means, vol is extremely elevated in Mar relative to Apr. The business of patents and patent portfolios exists in a wonderful world of uncertainty and in many ways, a magical (but real) promise of greatness.
I found VHC using the real-time custom scan that hunts for calendar spreads between the front two monthly expiries.
Custom Scan Details
Stock Price GTE $5
Sigma1 - Sigma2 GTE 7
IV30™ GTE 30
Average Option Volume GTE 1,200
The goal with this scan is to identify back months that are cheaper than the front by at least 10 vol points. I'm also looking for a reasonable amount of liquidity in the options (thus the minimum average option volume) and enough strikes to spread and thus a minimum stock price. I also require a minimum vol level in order to avoid any boring ETFs (or whatever).
Let’s start with the Skew Tab to examine the month-to-month and line-by-line vols.

We can see how elevated Mar is to Apr as well as how flat Apr skew appears when compared to Mar. If you peak at the vertical axis you can see how large the vol diff is – on the downside we’re looking at nearly 2x vol in Mar to Apr. When we look at the Charts Tab, we’ll see why…
The two-year VHC Charts Tab is included (below). The top portion is the stock price the bottom is the vol (IV30™ - red vs HV20™ - blue vs HV180™ - pink).

On the stock side we can see some absolutely enormous stock moves in short bursts of time. The stock more than doubled in that first highlighted are, then was cut by more than 50% in the next highlighted area. All told, this stock has been as low as $11.01 and as high as $41.93 in just two years.
On the vol side we can see the explosion into the earnings cycle in Nov of 2012, when IV30™ hit as high as 212%. Whoa…
Finally, let's look to the Options Tab (below).

Across the top we can see that Mar vol is priced to 100.02% while Apr vol is priced to 63.93%, so about a 36 vol point diff. But look at some specific strikes. The Mar/Apr 30 put spread shows a ~40 point vol diff, and though not pictured here, the Mar/Apr 27 vol diff sows a 60 point vol diff.
Something is coming in the next five days, or so says the option market.
Disclosure: This is trade analysis, not a recommendation.
Images provided by Livevol®
