QNB Group has published today its Vietnam Economic Insight 2016 report. Vietnam is a standout performer amongst emerging markets, led by strong export growth and firming domestic demand.
- Despite uncertainty surrounding the future of the Trans-Pacific Partnership (TPP), Vietnam’s export outlook is positive having concluded trade deals with South Korea and the European Union
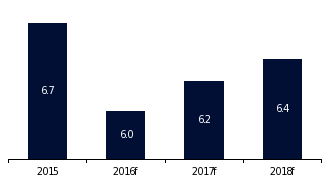
- That being said, we expect real GDP to moderate in 2016 caused by a major agricultural drought, lower commodity prices squeezing producers and weaker external demand
- Thereafter, real GDP growth should pick up to 6.2% in 2017 and 6.4% in 2018 as demand for Vietnam’s exports picks up again reflecting the influence of new trade deals as well as continued growth in investment and consumer spending
Real GDP (%, year-on-year)

Sources: General Statistics Office of Vietnam (GSOV), Haver Analytics and QNB Economics forecasts
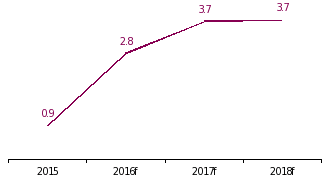
- Inflation is expected to rise to 2.8% in 2016, supported by higher prices for food, housing and currency depreciation
- In 2017, inflation should reach 3.7% and remain stable thereafter in 2018, reflecting a pickup in global commodity prices, the recovery in house prices and strong domestic demand
Inflation (%, annual average)

Sources: GSOV, Haver Analytics and QNB Economics forecasts
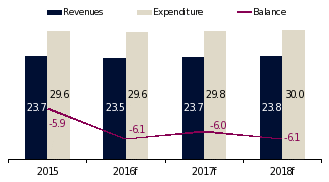
- We expect the deficit to widen in 2016 to 6.1% of GDP from 5.9% in 2015 on slower growth in revenues on account of weaker export growth and continued investment and social spending
- The deficit budget is expected to be stable around 6.1% in 2017 and 2018 as revenue growth from higher commodity prices and stronger economic activity will be matched by continued expenditure growth to meet investment and social spending objectives
- As a result, we expect public debt to reach 62.2% of GDP by 2018
Fiscal balance (% of GDP)

Sources: GSOV, Haver Analytics and QNB Economics forecasts
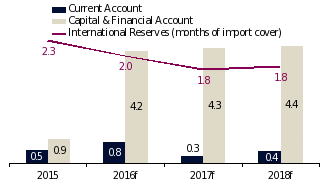
The current account surplus is expected to widen in 2016 to 0.8% of GDP primarily as result of slower import growth
But the current account should recede to around 0.4% in 2017 and 2018, as oil prices climb, making imports more costly, therebypartly offsetting export growth
Current Account (% of GDP)

Sources: State Bank of Vietnam, Haver Analytics and QNB Economics forecasts
Other recent QNB Economic Insight reports include China, India, Indonesia, Jordan, Kingdom of Saudi Arabia, Kuwait, Oman, Qatar, Singapore and the United Arab Emirates and are available on the QNB Group website. QNB Group operates in more than 30 countries across 3 continents and its economic reports leverage its knowledge of these markets to provided added value for its clients and counterparties.
Disclaimer and Copyright Notice: QNB Group accepts no liability whatsoever for any direct or indirect losses arising from use of this report. Where an opinion is expressed, unless otherwise provided, it is that of the analyst or author only. Any investment decision should depend on the individual circumstances of the investor and be based on specifically engaged investment advice. The report is distributed on a complimentary basis. It may not be reproduced in whole or in part without permission from QNB Group.
