Data is data. It is cold and lifeless - and it takes some understanding of dynamics affecting that data set to provide context. I see one data set that makes no sense.
Follow up:
Historically, trade not only tells the story of the health of the global economy - but also shows the health of the individual economies when one looks at the imports into and exports from that economy.
The graph below shows the imports (blue line) and exports (red line) for the USA - all indexed against GDP.
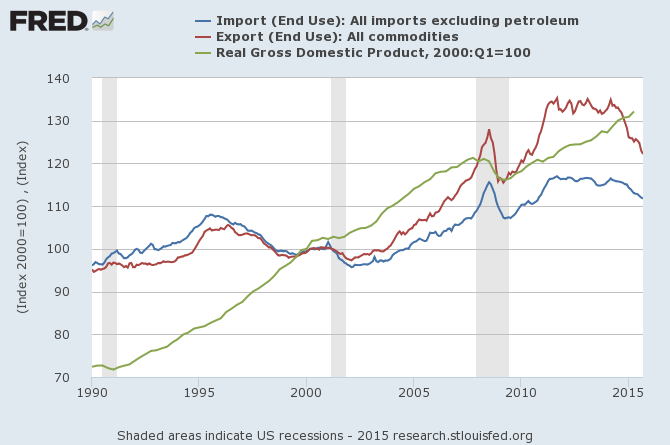
Here are the takeaways from this graph:
- Although a lot of folks badmouth trade agreements (including this pundit in the past) - the export red line shows since 2000 USA exports have grown faster than imports (in fact almost twice as fast). It does appear that free trade agreements have helped the USA economy but there is no control element to understand if this is true. It could be that exports would have grown more without the free trade agreements?
- On a real (inflation adjusted) basis, since 2000 GDP is up over 30%, imports up over 20%, and imports up over 10%.
- Exports and imports are becoming less and less important to the USA economy (based on contribution to GDP).
- For over a year both imports and exports have fallen dramatically. This is a historical flag for a recession. Imports tell a story of the health of the consuming class, and exports are related to the strength of the global economy.
- Yet, despite the dramatic decline of exports and imports, there is no other indicator of a recession in the data I review. The dollar has strengthened, which would affect exports (as they would be more dear) - but on the other hand it should be a tailwind to imports (as they become cheaper). Yet both imports and exports are in decline. If the economy continues to muddle along even with this dramatic decline of exports and imports, this could further the evidence of the decline role of trade in the economy.
Still, all portions of the economy do not act in concert. One element can have an obvious recession while other elements are growing. In the event of a recognized recession, one element almost always seems to indicate first. Could this be the first indication?
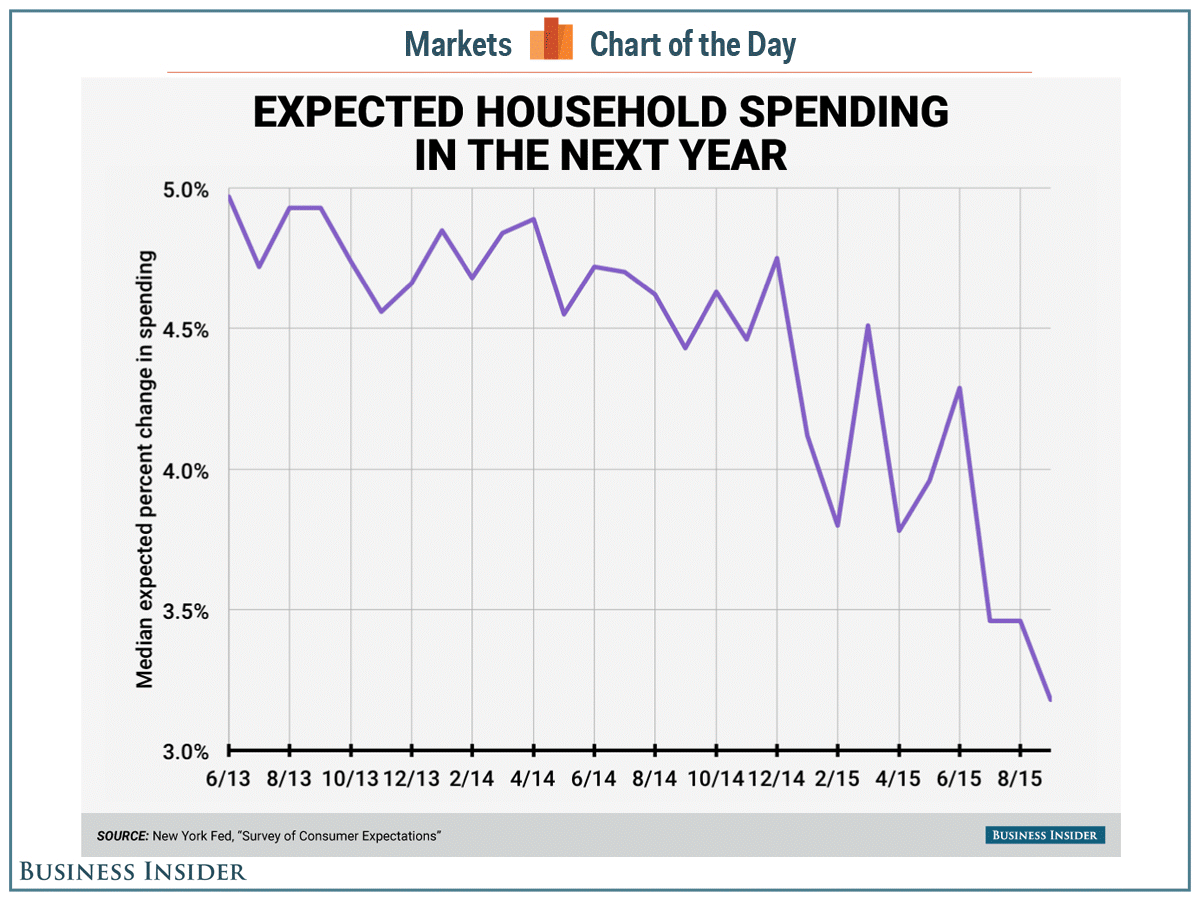
Although I am not a fan of opinion surveys, the New York Fed's monthly Survey of Consumer Expectations released this past week shows American consumers are feeling increasingly pessimistic about their future spending. As of September, the median household sees its spending growing just 3.2%, the lowest level in the survey's two year history. The consumer is over 2/3rds of the USA economy.
Using our New Normal methodology, Econintersect does not foresee a recession. This does not stop us investigating data anomalies - and steep declines of imports and exports simultaneously raises questions about the health of the economy.
Other Economic News this Week:
The Econintersect Economic Index for October 2015 was statistically unchanged from September - and remains in the low range of index values seen since the end of the Great Recession. The tracked sectors of the economy generally showed some growth. Our economic index remains in a long term decline since late 2014.
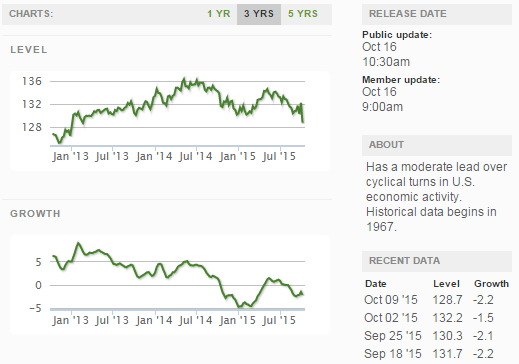
The ECRI WLI growth index is now in positive territory but still indicates the economy will have little growth 6 months from today.
Current ECRI WLI Growth Index
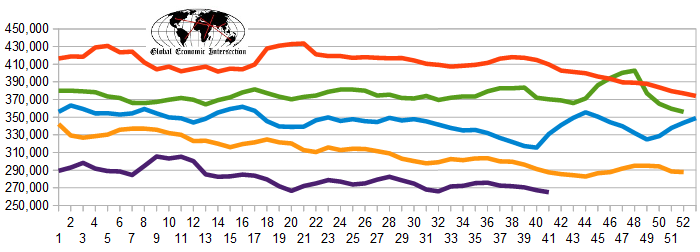
The market (from Bloomberg) was expecting the weekly initial unemployment claims at 252 K to 275 K (consensus 270,000) vs the 255,000 reported. The more important (because of the volatility in the weekly reported claims and seasonality errors in adjusting the data) 4 week moving average moved from 267,250 (reported last week as 267,500) to 265,000. The rolling averages generally have been equal to or under 300,000 since August 2014.
Weekly Initial Unemployment Claims - 4 Week Average - Seasonally Adjusted - 2011 (red line), 2012 (green line), 2013 (blue line), 2014 (orange line), 2015 (violet line)
Bankruptcies this Week: Affirmative Insurance Holdings (fka Instant Insurance Holdings), Privately-held CCNG Energy Partners, Nord Resources, SG Blocks
Click here to view the scorecard table below with active hyperlinks
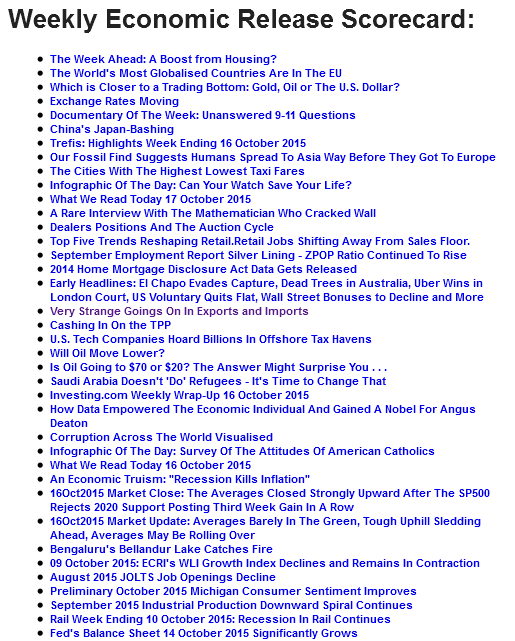
Weekly Economic Release Scorecard:
