Who is Kevin Hassett? Wolfe looks at the Trump ally tipped to become Fed Chair.
Verizon (NYSE:VZ) stock reached its all-time high twenty years ago, in October 1999. The dot-com bubble was at full swing and few questioned the validity of the bullish thesis. Stocks were supposed to never stop rising and make everyone rich. Unfortunately, the bulls gave up as soon as Verizon touched $64.
Nine years later, in October 2008, VZ stock was barely holding above $21.50. The second largest telecommunications company in the US lost two-thirds of its market value in less than a decade. And just when the future looked the bleakest, the bulls finally returned.

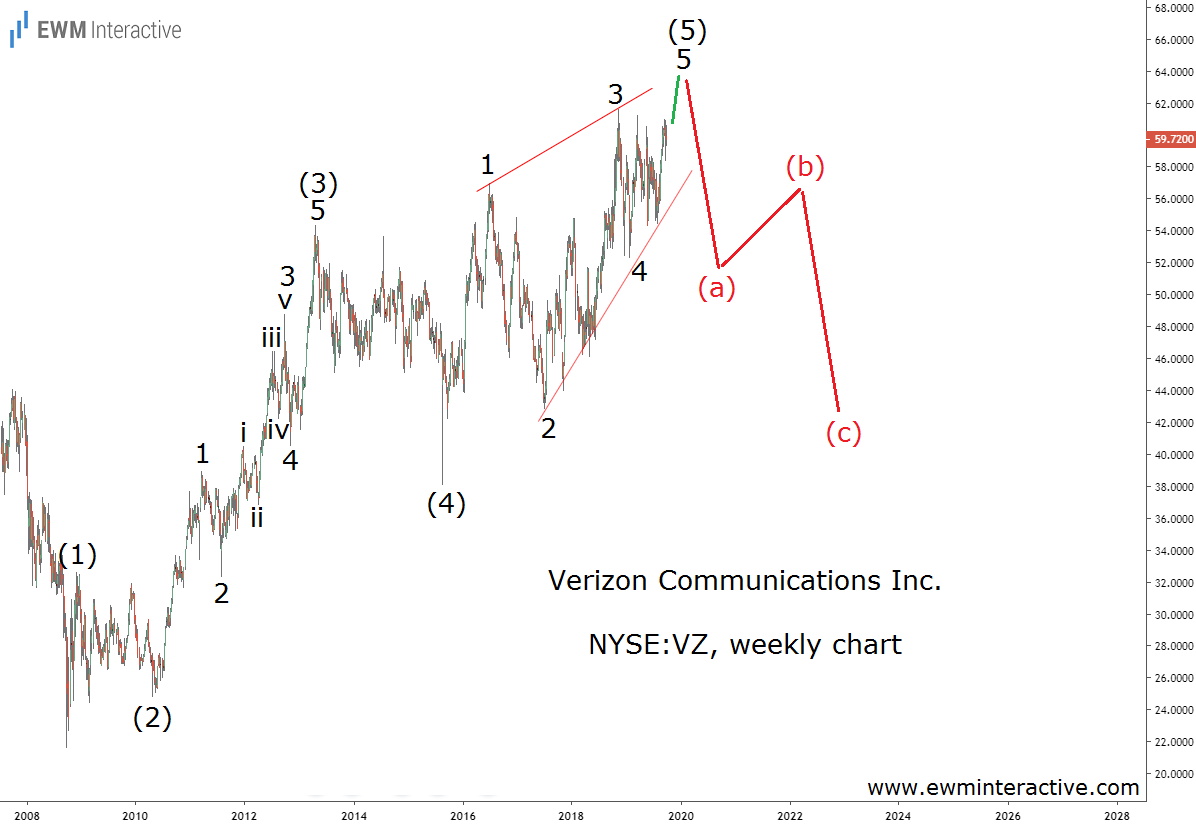
Verizon (NYSE:VZ) closed slightly below $60 a share yesterday. It is now within a striking distance of a new record, twenty years after reaching the previous one. The only question is, can it last this time? The Elliott Wave chart below doesn’t look very encouraging.
Verizon’s weekly chart reveals the stock’s entire 11-year recovery since October 2008. It looks like a classic five-wave impulse, labeled (1)-(2)-(3)-(4)-(5). Wave (3) is extended and its five sub-waves are also visible. Wave 5, on the other hand, is an ending diagonal.
The theory states that a three-wave correction in the other direction follows every impulse. If this count is correct, a bearish reversal can lead to a notable decline in the years ahead. The support area near $43 a share looks like a natural target for the bears once wave 5 of (5) is over.
Whether Verizon (NYSE:VZ) will make a new all-time high or not is not very important. What matters is that even if it does, the uptrend probably won’t continue for very long. We think the resistance near $65 a share can cause a 30%-35% plunge. Global recession fears only make the bearish case stronger.
