Upside momentum continues to favor utility stocks, which retain top billing among US sectors in the one-year total return column via a set of proxy ETFs. These companies have been strong all year, which is starting to worry some analysts. Brian Krawez at Scharf Investments, for instance, told Forbes this week that he’s recommending that investors steer clear of utilities because “they’re trading well above their historical averages in terms of multiples.” Maybe so, but the technical profile in this corner still looks strong. The positive momentum will fade eventually, although it’s not obvious from the rear-view mirror that the turning point is imminent.
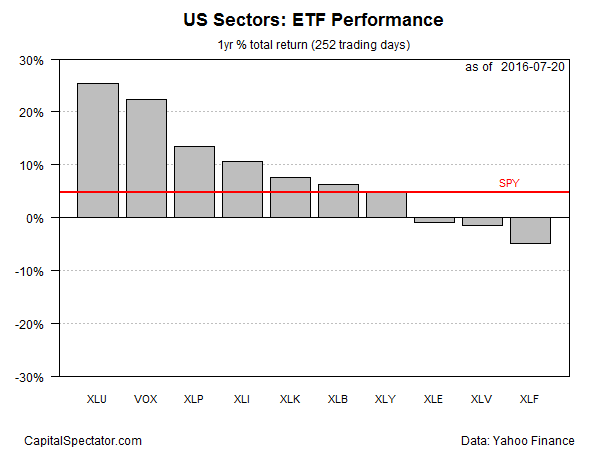
The Utilities Select Sector SPDR ETF (NYSE:XLU) is up more than 24% on a total-return basis through yesterday (July 20) vs. the year-ago price. That’s a modest edge over the number-two performer, Vanguard Telecommunication Services (NYSE:VOX), which is ahead by 21% for the past year.
Several factors are reportedly driving assets into XLU and VOX, starting with relatively rich dividend yields. Indeed, both ETFs have trailing payouts well above 3%, according to Morningstar.com. That’s a substantial premium over the benchmark 10-year Treasury Note, which is currently yielding about half as much at 1.59% as of July 20, based on data via Treasury.gov. Another factor is the popularity of so-called low-volatility strategies this year, which traditionally includes utilities and telcom. Bloomberg recently labeled the demand for products in the niche as “this year’s hottest ETF trend.”
Whatever the explanation for the crowd’s love affair this year with utilities and telecom, there’s no denying the passion for these sectors in absolute and relative terms. Compared with the stock market’s modest 4.3% total return for the past 12 months, XLU and VOX have been rocketing higher.

As for the losers, financial stocks have recently fallen to the back of the bus, inheriting the position from long-suffering energy stocks, which had been dead last among the major sectors for an extended period. But now the Financial Select SPDR (NYSE:XLF) is trailing the rest of the field with a negative 4.9% total return for the past year. The Energy Select SPDR (NYSE:XLE) is still underwater for the trailing 12 months as well, but just barely via a 0.8% loss.
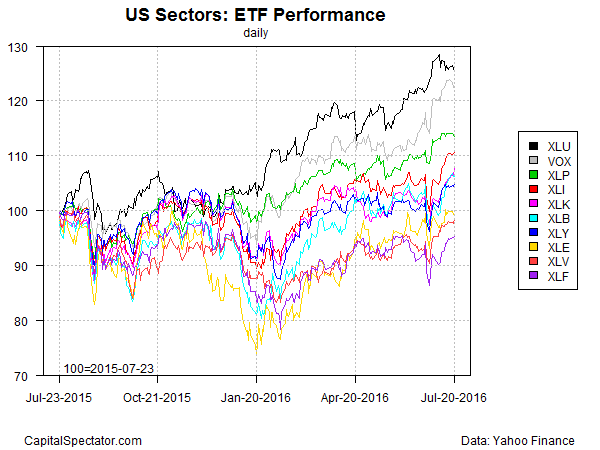
For another perspective on relative performance, consider the next chart below, which compares how a $100 investment in all the sector funds a year ago would have fared through yesterday. As you can see, there’s not much of a contest—the utility sector (XLU) is far and away the big winner.

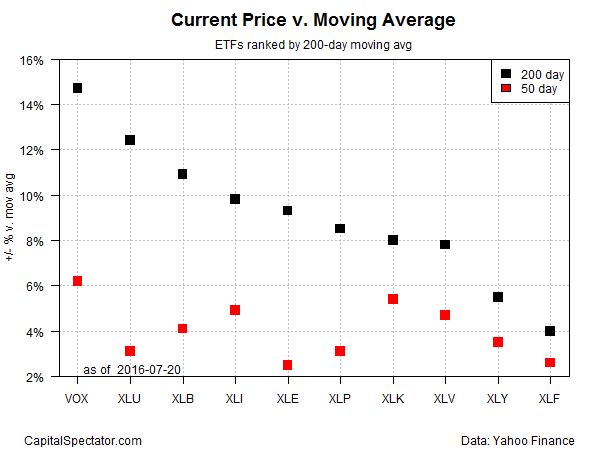
Let’s visually compare how the momentum profiles stack up by ranking the current sector ETF prices vs. their respective 50- and 200-day moving averages. Note that VOX is currently posting the strongest profile on this score—the telecom ETF’s price commands the highest premium over its 50- and 200-day averages. The utility sector ETF is almost as strong via its 200-day average, but XLU has recently faded relative to its 50-day average. Is that an early clue that the utility rally is losing its mojo?

