Investing.com’s stocks of the week
Summary
With Treasury yields topping out for now, utilities should continue to outperform the broader market.
Bad news continues for Dominion Resources Inc (NYSE:D).
Other stocks in the sector are also performing well.
Let's begin with a look at interest rates. Utilities are very influenced by the credit market for two reasons. First, this sector competes with bonds for investors; as bond yields become more competitive with utility yields, expect investors to buy more bonds. Second, utility companies are heavily dependent on debt financing. As yields rise, so do utilities' fixed costs, which can eat into utility profits.
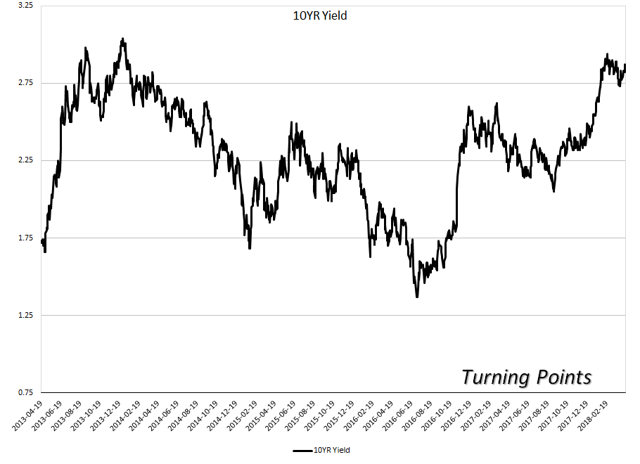
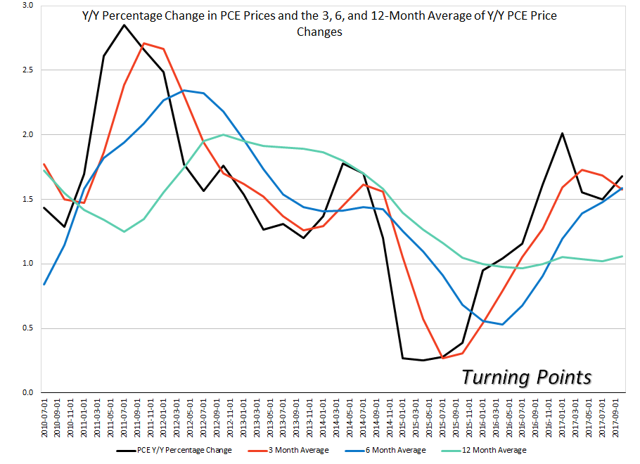
The 10-year CMT rose at the beginning of the year, climbing from about 2.3 to a little under 3%. This sent the stock market and the utility sector lower. But bond yields have hit a bit of a ceiling. One of the main reasons is that inflation – which is one of the primary inputs into yields – is still very tame:
The Y/Y percentage change in PCEs is still below 2%. And the moving averages for the Y/Y percentage change are low with little reason to move above 2% anytime soon.
Add these elements together and you have a ceiling for Treasury yields.
Next, let's look at the NYSE:XLUs performance relative to the NYSE:SPYs:
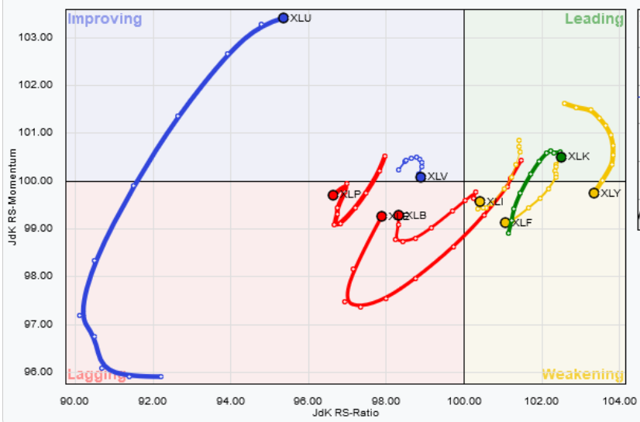
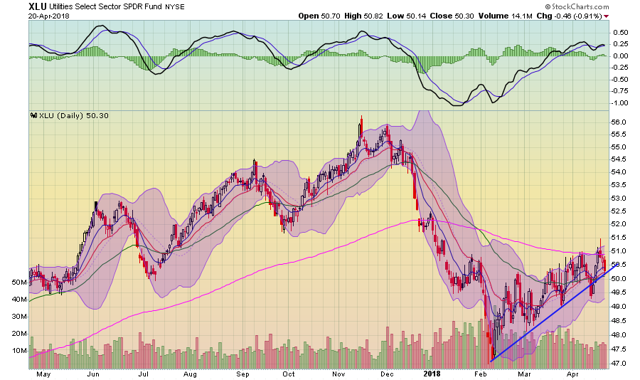
The XLUs continue to improve relative to the SPYs. In fact, they remain one of the strongest performing sectors. A look at the sector's chart explains why:
The XLUs have been in an uptrend since early February. There is now an upward-sloping trend line that connects lows from early February, early March, late March, and mid-April. This is a trudging rally; every step forward is accompanied by a step back. While this is certainly not exciting, it's actually a far healthier rally because it indicates that traders are thinking about their decisions incrementally.
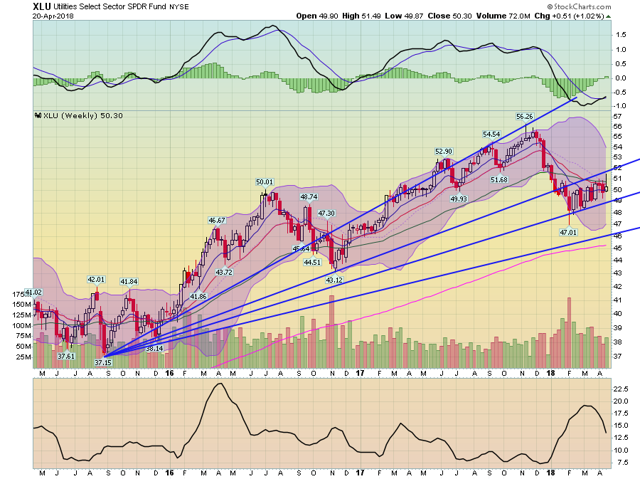
The weekly chart is also very encouraging:
For most of 2017, prices were using the 20-week EMA for technical support. But when the Treasury market started to sell off at the end of last year, utility prices broke through both the 20- and 50-week EMA. Now prices have found support on a Fibonacci fan and are slowly moving higher. Momentum (the MACD in the top panel) is about to turn more bullish.
And finally, the daily EMA chart is positive as well:
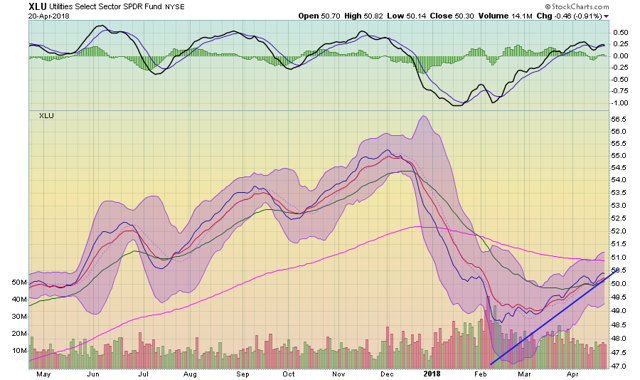
The MACD (top panel) is once again moving higher. And the shorter EMAs (the 10-day is green while the 20-day is red) are both moving higher again. Each is also above the 50-day EMA, another bullish development.
Let's next turn to some of the larger individual members of the XLUs:
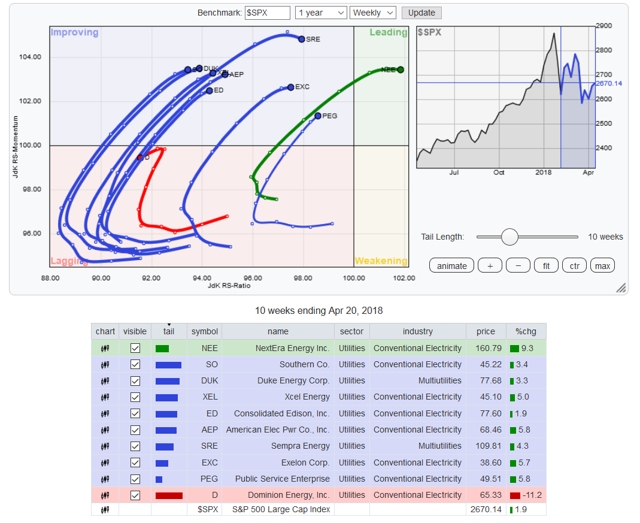
Let's start with the worst performer - Dominion (NYSE:D). Its takeover of Scana (NYSE:SCG) is now in deeper jeopardy (please see my analysis of the deal here):
Dominion Energy Inc.'s $7.9 billion takeover of troubled utility-owner Scana Corp (NYSE:SCG). is looking even less likely to happen after a bill passed by South Carolina legislators late Wednesday.
The state Senate voted to cut the money Scana can collect from customers for a half-finished nuclear power project the company scrapped last year. Dominion has threatened to call off the merger with Scana should legislators make such a move, and the company reiterated Wednesday that it stands by previous statements. Scana fell as much as 2.6 percent to $36.26 in after-markets trading.
As a result, the stock price is still very weak:
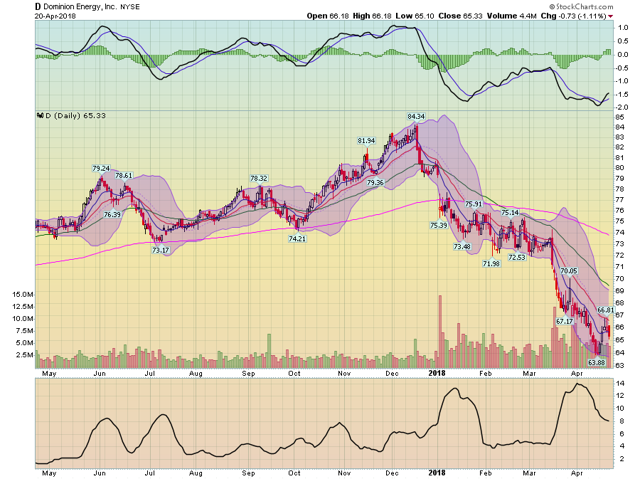
Dominion can't catch a technical break. It tried to rally last week, but hit resistance at the 20-day EMA when the above-referenced news story broke. The EMAs are bearishly aligned (the shorter EMAs are below the longer EMAs, which continues to pull the averages lower) and momentum is weak.
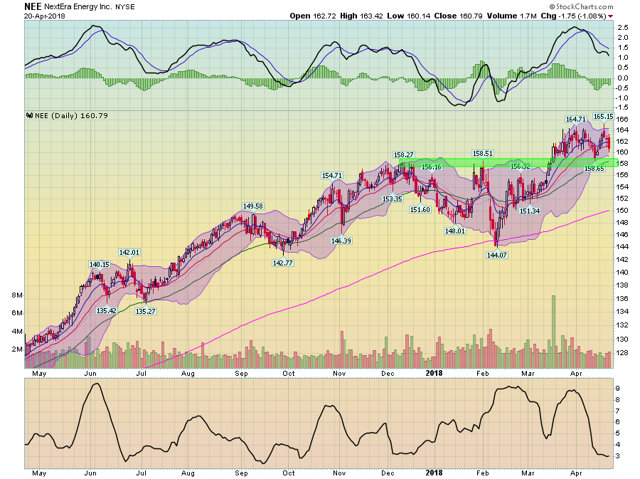
Let's now turn to the top of the list by looking at NextEra Energy Inc (NYSE:NEE), which I've discussed twice in the last month (see here).
NEE had resistance in the upper-150s, which prices broke through in mid-March. They have since been moving sideways. Momentum is moving lower, but so far prices are using the previous resistance area (the upper-150s) as technical support. Fundamentally, the company is sound, which explains why it continues to find a bid.
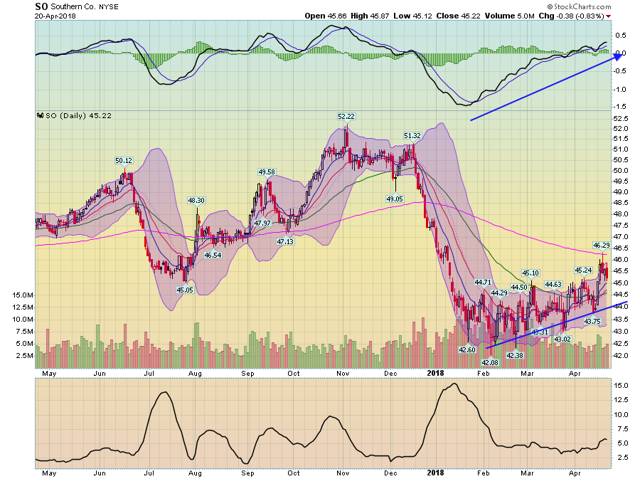
Southern Company (NYSE:SO) is also performing well relative to the SPYs.
Its chart is more akin to the XLUs - Southern's prices are below the 200-day EMA and are trudging higher. The EMAs are slowly turning to a more bullish orientation and momentum is rising. I reviewed the company's 2017 performance at the end of February. While the results were generally positive, there is ongoing shareholder litigation which is concerning.
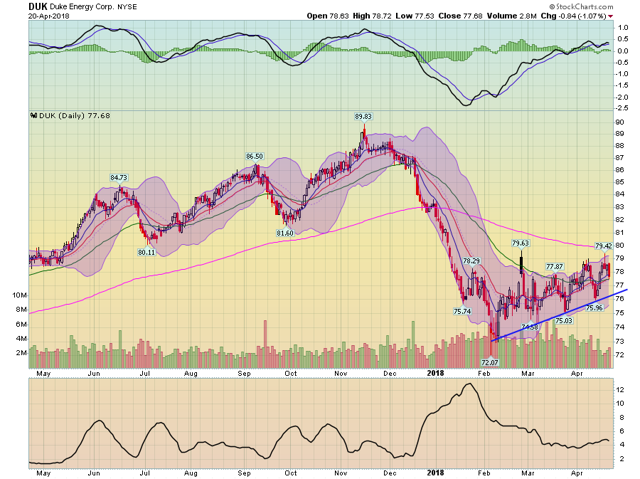
Duke Energy Corporation (NYSE:DUK) is also performing well relative to the SPYs:
Again we have a chart that is similar to the XLUs - a trudging rally. I reviewed Duke's latest performance earlier this year and concluded:
Duke Energy (NYSE:DUK) remains a technical buy at current levels. Their revenues and margins are increasing while yielding 4.71%. But also remember that the fixed income market is repricing risk, adding a headwind to utilities trading.
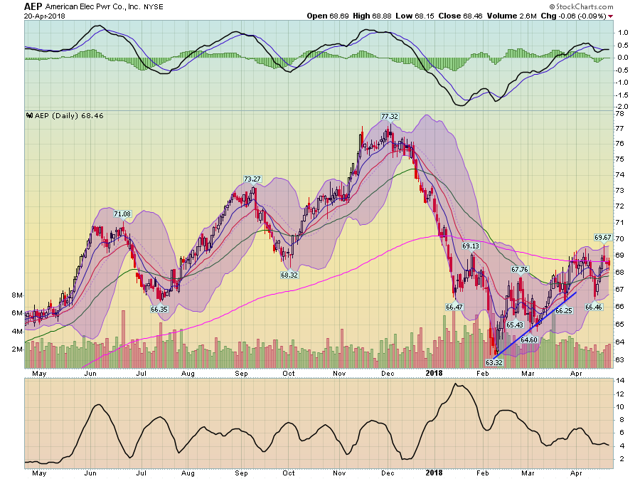
Finally, American Electric Power Company Inc (NYSE:AEP) is looking very interesting:
There are two ways to look at this chart. The first is that prices have formed a short-term double top as prices hit resistance at the 200-day EMA. The second is that prices are consolidating below the 200-day EMA before they make a run above this technical barrier. I'm opting for the latter, based on the stock and sector momentum relative to the SPYs. I reviewed AEP earlier this year; it remains a well-diversified utility.
Disclosure: I am/we are long DUK.
I wrote this article myself, and it expresses my own opinions. I am not receiving compensation for it (other than from Seeking Alpha). I have no business relationship with any company whose stock is mentioned in this article.

