It continues to amaze me, the love affair between Wall Street and the Bureau of Labor Statistics (BLS) employment situation report – aka the Jobs Report. It is nearly a worthless data set in real time if your intent is to have some vision of market and economic direction.
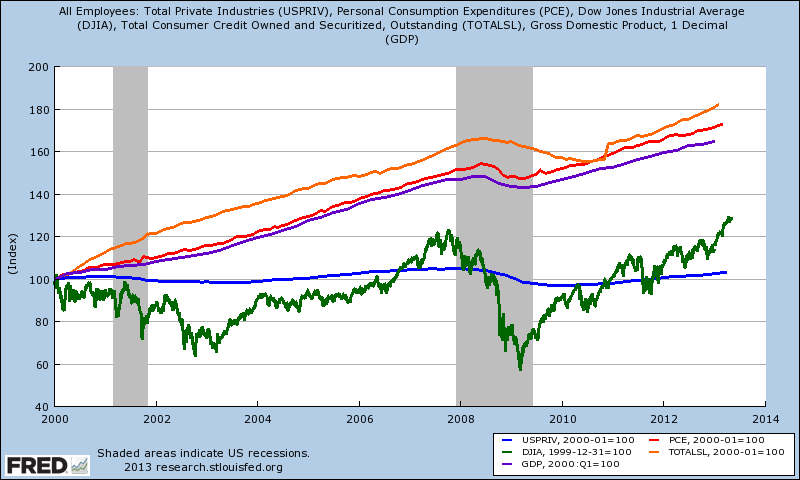
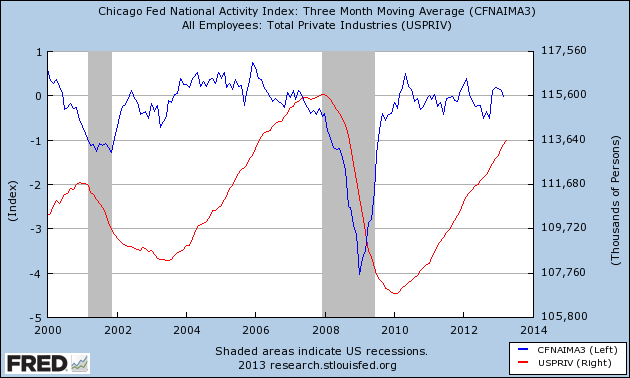
Much has been written on this topic. Here are three views of the BLS Jobs data:
Non-Farm Private Employment (lighter blue line), Dow Jones Industrial Average (green line), GDP (dark blue line), Personal Consumption Expenditure (red line) and Consumer Credit (orange line) – all indexed to Jan 2000

Consider that indicators do not need to be logical – they just need to work. There is no evidence that jobs data has any forward vision. Historically, jobs gave little clue of an impending recession, or indication a recovery had begun until the economic recovery was well underway. Comparing jobs to the Chicago Fed National Activity Index (CFNAI) is about a six month to one year lag for alerting one to economic turning points.

And neither the BLS jobs report or the CFNAI is accurate in real time – but both are accurate within 12 months for pinpointing turning points.
So it begs the question: Why does the market focus on the jobs report?
Other Economic News this Week:
The Econintersect economic forecast for May 2012 declined marginally, but remains in a zone which says the economy is beginning to grow normally. There are some warning signs that our interpretation is not correct – but we will see how these play out in the coming months.
The ECRI WLI growth index value has been weakly in positive territory for over four months – but in a noticeable improvement trend. The index is indicating the economy six month from today will be slightly better than it is today.
Current ECRI WLI Growth Index

Initial unemployment claims fell from 324,000 (reported last week) to 323,000 this week. Historically, claims exceeding 400,000 per week usually occur when employment gains are less than the workforce growth, resulting in an increasing unemployment rate (background here and here).
The real gauge – the 4 week moving average – modestly improved from 342,250 (reported last week) to 336,750. Because of the noise (week-to-week movements from abnormal events AND the backward revisions to previous weeks releases), the 4-week average remains the reliable gauge.
Weekly Initial Unemployment Claims – 4 Week Average – Seasonally Adjusted – 2011 (red line), 2012 (green line), 2013 (blue line)

Bankruptcies this Week: SBM Certificate, Skinny Nutritional
Data released this week which contained economically intuitive components(forward looking) were:
- Rail movements remain mixed.
Weekly Economic Release Scorecard:
Click here to view the scorecard table below with active hyperlinks
 Editor's Note: Learn how to profit from the Non-Farm Payrolls Report, one of June's biggest market-moving announcements. Watch expert Steve Ruffley trade the NFP in real time on June 7, 2013 via our Special Live Event. Ruffley has an astounding record of 25 consecutive, profitable sessions during this event, so don't miss this chance to learn how to trade during volatile periods. To find out more, click here.