
We’ll shun jargon today and make it as simple as we can for bulls who have patiently stood by gold since it began its long dirge nearly two years ago. Looking at the picture below of Comex August futures, the weight of selling in recent months should be apparent even to those who know nothing about charts.
It projects a potentially important low at 1219.40 that would imply a nearly 12% fall from current levels. That outcome, our worst-case scenario for the next 3-4 weeks, would become an odds-on bet if August Gold were to settle for two consecutive days beneath the red line at 1353.70. There would be no guarantees at that point that 1219.40, a major “Hidden Pivot" support, would hold, but we would be prepared to bottom-fish there aggressively in any event, albeit with a very tight stop-loss.
More specifically, we would use our proprietary “camouflage trading” technique to hold theoretical risk as low as possible. 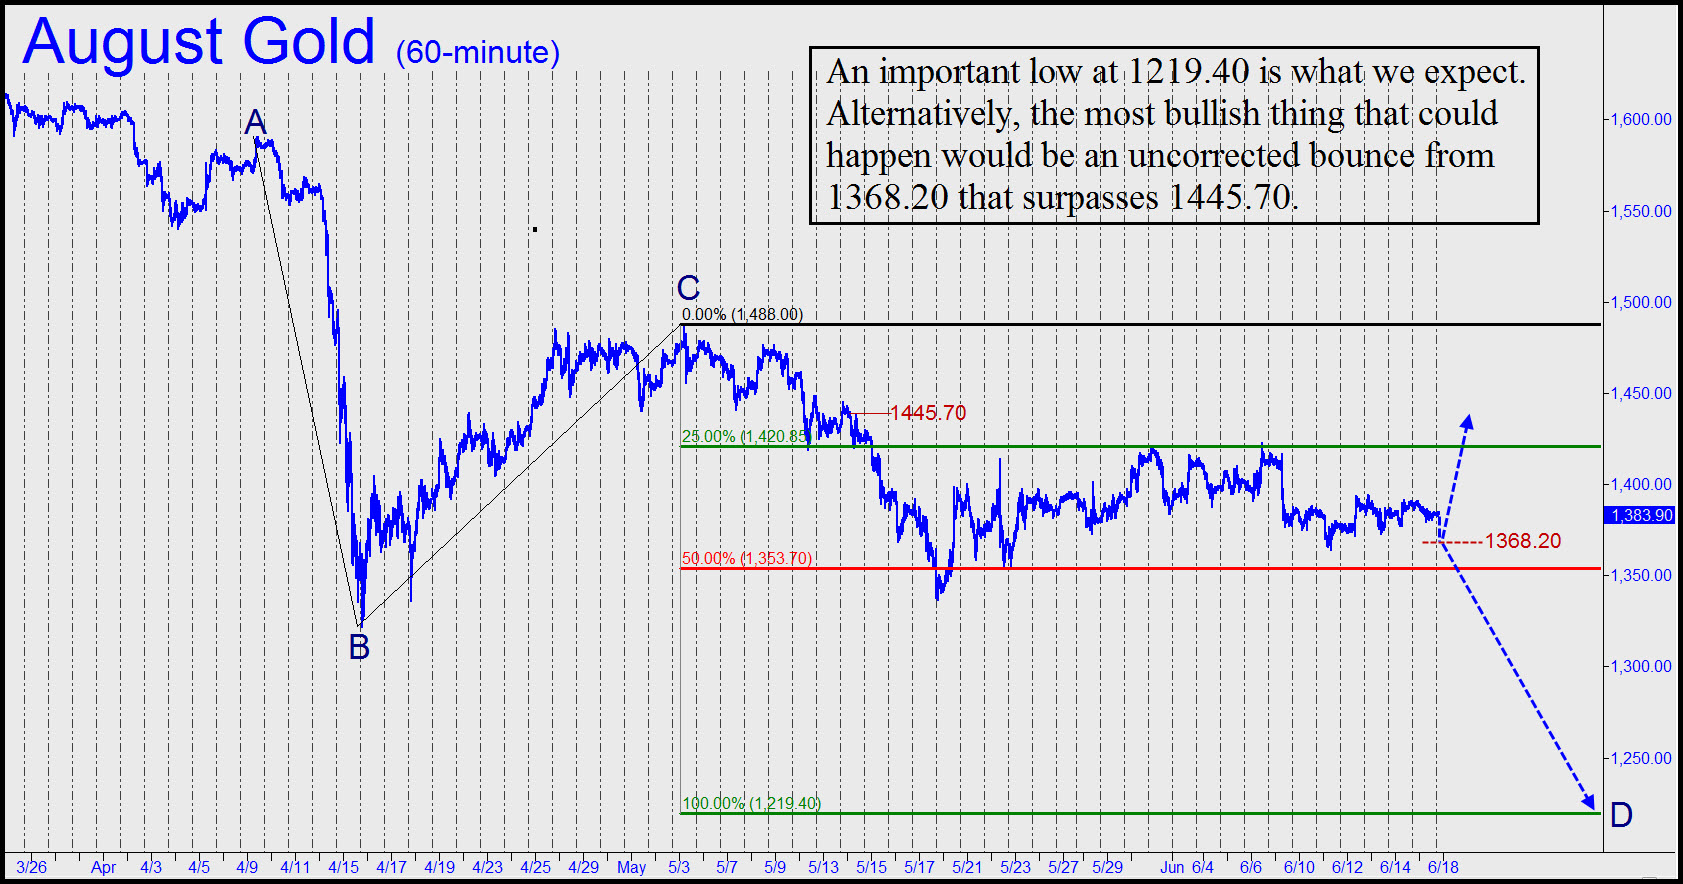
Looking on the brighter side, the very best that bulls could hope for over the near term would be a strong bounce from 1368.20, which lies just below. Although that number is a minor “hidden” support according to the technical system we use, it is the very first spot at which bulls might hope to find good traction. Any lower, though, would indicate at least $26 more slippage, to a 1342.00 support that is a “cousin” to 1368.20.
Bears Struggling Too
Another possibility is that the futures will continue top-move sideways without breaking significantly higher or lower. The odds of this would appear to be low, since, as you can see in the chart, bulls have been struggling hard just to stay afloat. It should be acknowledged as well, however, that bears have been unable to push gold lower easily. In fact, they have made zero net progress since mid-April, when August Gold was trading exactly where it is now.
If you want to tune out the noise and set a wake-up call for when “something” happens, we would suggest monitoring price points at 1438.90 and 1353.60. Any rally that touches the first number would generate a robustly bullish “impulse leg” on the intraday charts.
If this were to occur within the next few days, starting with a bounce from the 1368.20 pivot noted above, bulls would have reason to celebrate, since a strong impulsive rally will have begun without the corrective downtrend having completed the big ABCD pattern shown. Such a sequence of events, precisely, is extremely bullish according to our runes. Indeed, it is how several bull markets we have observed over the years have begun — i.e., with an upward lurch from a place seemingly off the radar of conventional support-and-resistance players.
- English (UK)
- English (India)
- English (Canada)
- English (Australia)
- English (South Africa)
- English (Philippines)
- English (Nigeria)
- Deutsch
- Español (España)
- Español (México)
- Français
- Italiano
- Nederlands
- Português (Portugal)
- Polski
- Português (Brasil)
- Русский
- Türkçe
- العربية
- Ελληνικά
- Svenska
- Suomi
- עברית
- 日本語
- 한국어
- 简体中文
- 繁體中文
- Bahasa Indonesia
- Bahasa Melayu
- ไทย
- Tiếng Việt
- हिंदी
Use Gold’s Technicals To Lower Short-Term Risk
Published 06/18/2013, 12:26 AM
Updated 07/09/2023, 06:31 AM
Use Gold’s Technicals To Lower Short-Term Risk
Latest comments
Loading next article…
Install Our App
Risk Disclosure: Trading in financial instruments and/or cryptocurrencies involves high risks including the risk of losing some, or all, of your investment amount, and may not be suitable for all investors. Prices of cryptocurrencies are extremely volatile and may be affected by external factors such as financial, regulatory or political events. Trading on margin increases the financial risks.
Before deciding to trade in financial instrument or cryptocurrencies you should be fully informed of the risks and costs associated with trading the financial markets, carefully consider your investment objectives, level of experience, and risk appetite, and seek professional advice where needed.
Fusion Media would like to remind you that the data contained in this website is not necessarily real-time nor accurate. The data and prices on the website are not necessarily provided by any market or exchange, but may be provided by market makers, and so prices may not be accurate and may differ from the actual price at any given market, meaning prices are indicative and not appropriate for trading purposes. Fusion Media and any provider of the data contained in this website will not accept liability for any loss or damage as a result of your trading, or your reliance on the information contained within this website.
It is prohibited to use, store, reproduce, display, modify, transmit or distribute the data contained in this website without the explicit prior written permission of Fusion Media and/or the data provider. All intellectual property rights are reserved by the providers and/or the exchange providing the data contained in this website.
Fusion Media may be compensated by the advertisers that appear on the website, based on your interaction with the advertisements or advertisers.
© 2007-2025 - Fusion Media Limited. All Rights Reserved.