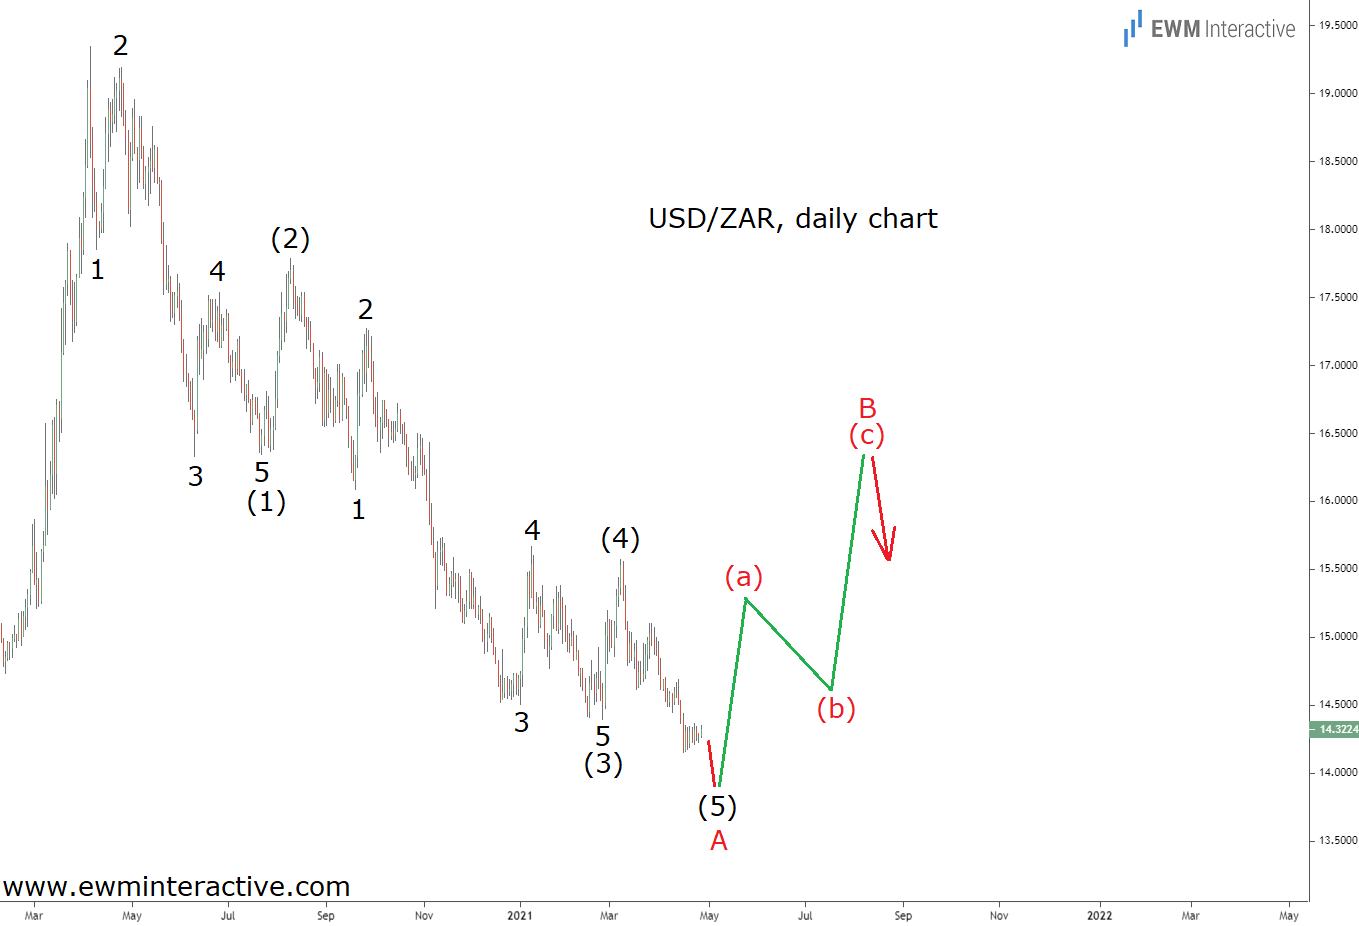
It’s been a bad year for USD/ZAR bulls. The pair has been declining ever since it reached a high of 19.34 in early-April 2020. As of this writing, it is barely holding above 14.30, down 26% in a little over twelve months. Does this mean now is a good time to join the bears?
We think it is the exact opposite. Not because we have some special insight into the economies of the two countries, the COVID-19 situation or their central banks’ upcoming rate decisions. Instead, we think selling USD/ZAR now would not be wise, because of the Elliott Wave chart below.

USD/ZAR‘s daily chart reveals that the structure of the decline from 19.34 is impulsive. The pattern is labeled (1)-(2)-(3)-(4)-(5) where the five sub-waves of (1) and (3) are also visible. Wave 5 of (1) is truncated since it didn’t breach the low of wave 3.
According to the theory, a three-wave correction in the opposite direction follows every impulse. This is the reason we think shorting USD/ZAR now would be a bad decision. Once wave (5) finds its bottom, a notable corrective recovery is likely to begin. Wave B can lift the pair above the 16.00 mark and possibly go for 16.50 before the downtrend resumes in wave C.
