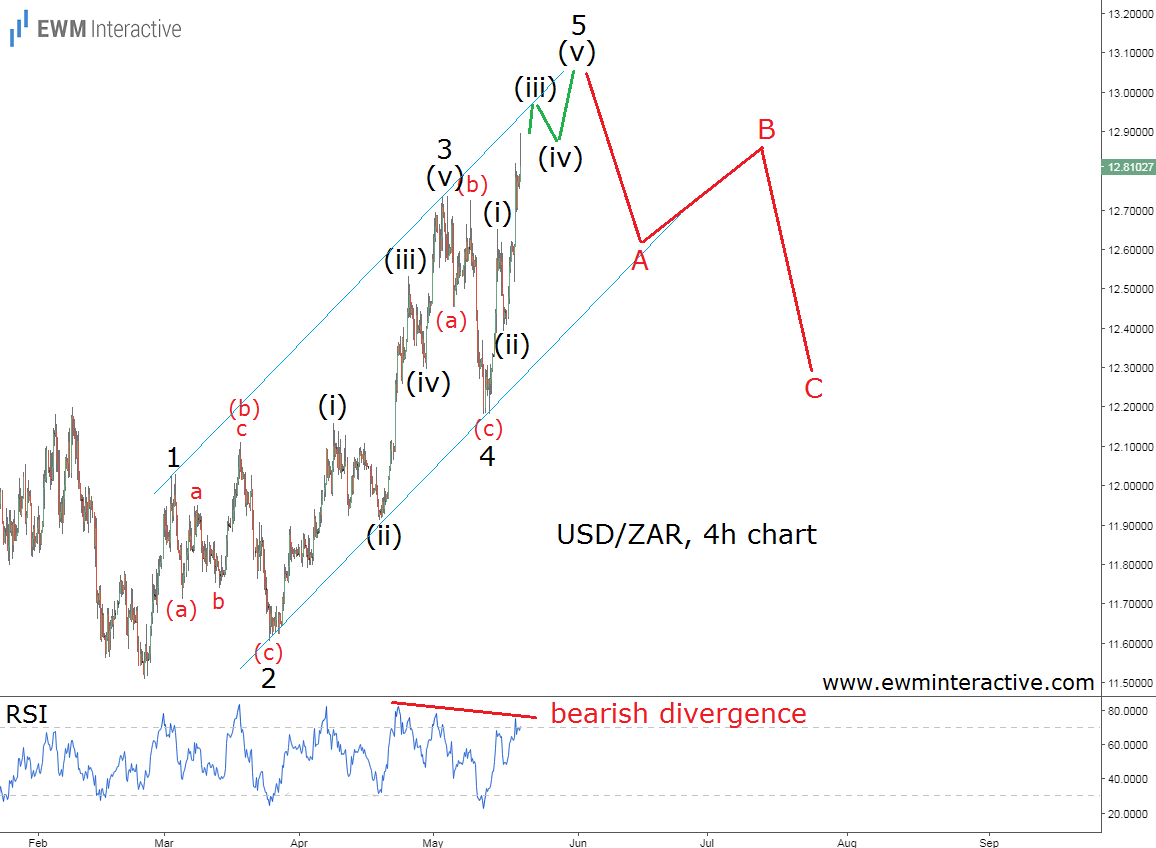
USD/ZAR, the ticker symbol of the U.S. Dollar – South African Rand Forex pair, is not among the ones we regularly cover. However, we are constantly looking for article material, so when a client asked us if we could take a look at it, we told him – no problem. The only thing we needed was a recognizable price pattern. Fortunately, there was one on USD/ZAR’s 4-hour chart given below.

USD/ZAR has been in recovery mode for the last three months. On February 26th the pair fell to as low as 11.5077. Earlier today it climbed to 12.8938, but the only thing traders are usually interested in is what to expect from now on. Is the exchange rate going to continue its ascent or stop in its tracks, because of a sudden bear attack? Judging from the chart above, the latter is much more likely.
The structure of USD/ZAR’s rally since February 26th forms a textbook five-wave impulse. The pattern has been developing within the parallel lines of a trend channel drawn through the tops of waves 1 and 3 and the lows of waves 2 and 4. The sub-waves of wave 3 are also clearly visible and labeled (i)-(ii)-(iii)-(iv)-(v). This impulse did not obey the guideline of alternation, since both corrective waves appear to be of the flats family – wave 2 is an expanding flat correction, which includes a new extreme in wave (b), while wave 4 looks like a regular flat, where wave (b) does not exceed the starting point of wave (a).
This, however, does not change the meaning carried by the whole five-wave pattern. According to the Elliott Wave Principle, every impulse is followed by a three-wave retracement in the opposite direction. In other words, a bearish reversal should be anticipated as soon as the bulls are done with wave 5. The following weakness has a good chance of dragging USD/ZAR down to the support area of wave 4 near 12.2000. The pessimistic outlook is also supported by the RSI indicator, which reveals a bearish divergence between waves 3 and 5.
In conclusion, it looks like USD/ZAR is going to reach the 13.0000 mark soon, but instead of joining the bulls traders need to prepare for a U-turn in that area. It is too early to short, but too late to buy as well.
