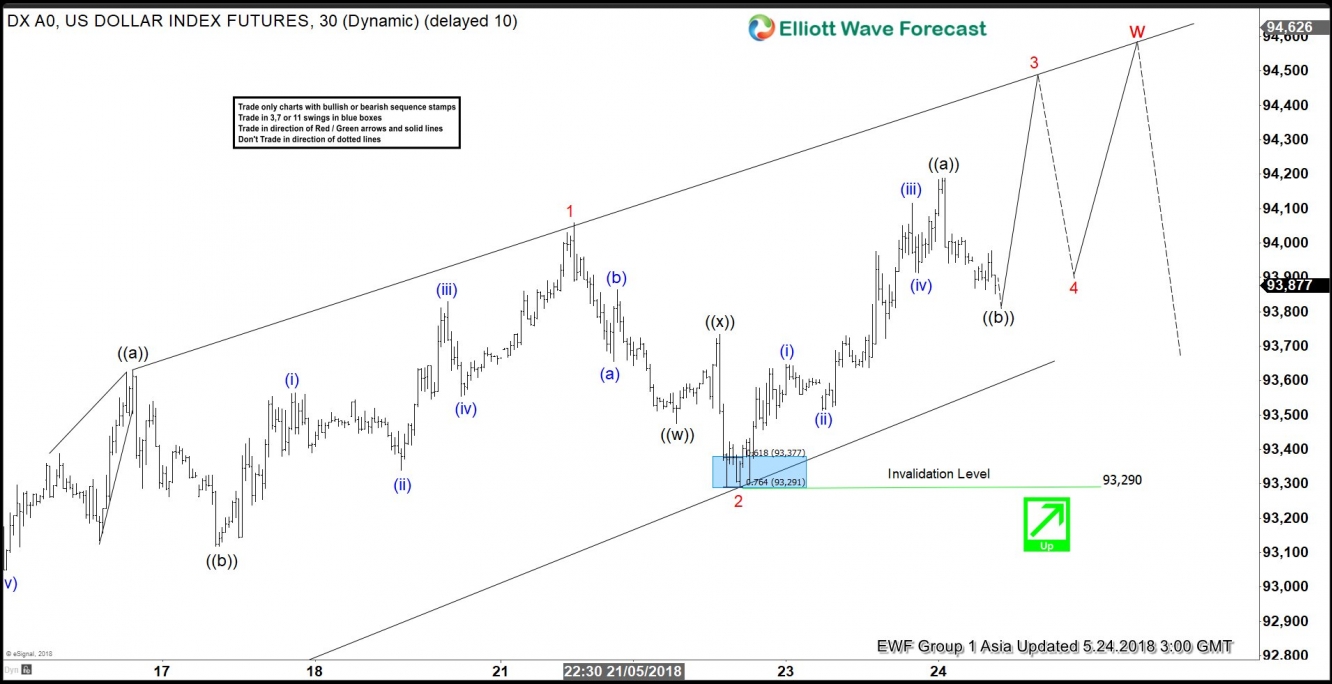
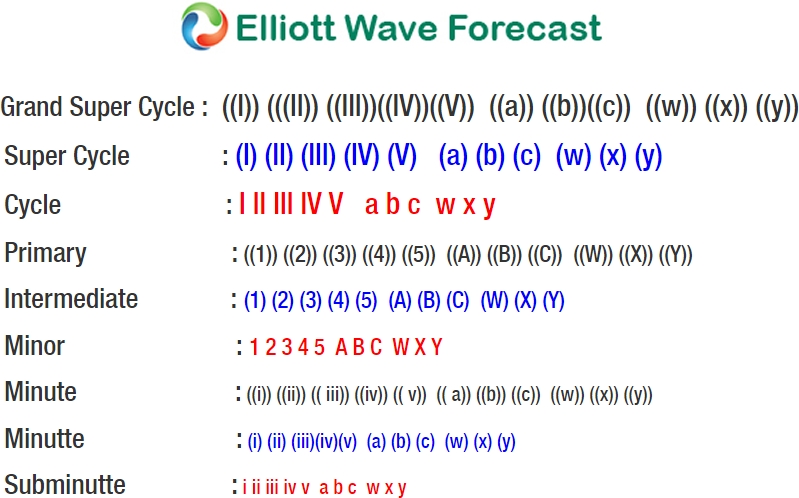
USDX short-term Elliott Wave view suggests that the rally from 5/14 low 92.24 is extending higher as Elliott Wave Ending diagonal structure within Intermediate wave (5). Keep in mind that Ending Diagonal usually appears in sub-division of wave (5) of impulse or wave C of Zigzag or Flat. In Ending Diagonal, the internal distribution of each leg is the combination of a 3 waves corrective structure i.e the internal of wave 1, 2, 3, 4 and 5 usually unfolds as double three, zigzag etc.
A rally from 5/14 low 92.24 to 94.05 high ended Minor wave 1 of (5). The internals of Minor wave 1 is unfolding as zigzag structure where Minute wave ((a)) at 93.63, Minute wave ((b)) ended at 93.11 low, and Minute wave ((c)) of 1 ended at 94.05. Then down from there, Minor wave 2 pullback ended at 93.29 low. The internals of Minor wave 2 is unfolding as a double three corrective structure where Minute wave ((w)) ended at 93.47, Minute wave ((x)) ended at 93.73 high, and Minute wave ((y)) of 2 ended at 93.29.
Near-term, as far as dips remain above 93.29 low, expect the index to extend higher in Minor wave 3 of (5) towards 95.09-95.52, which is 100%-123.6% Fibonacci extension area of 1-2. Afterwards, the index should pullback in Minor wave 4 of (5) in 3, 7 or 11 swing structure before a final push higher is seen. The last push higher in wave 5 of (5) in the Index should also end Cycle degree wave “w” & then it should do larger correction in Cycle degree wave “x”. We don’t like selling the Index.
USDX 1 Hour Elliott Wave Chart


