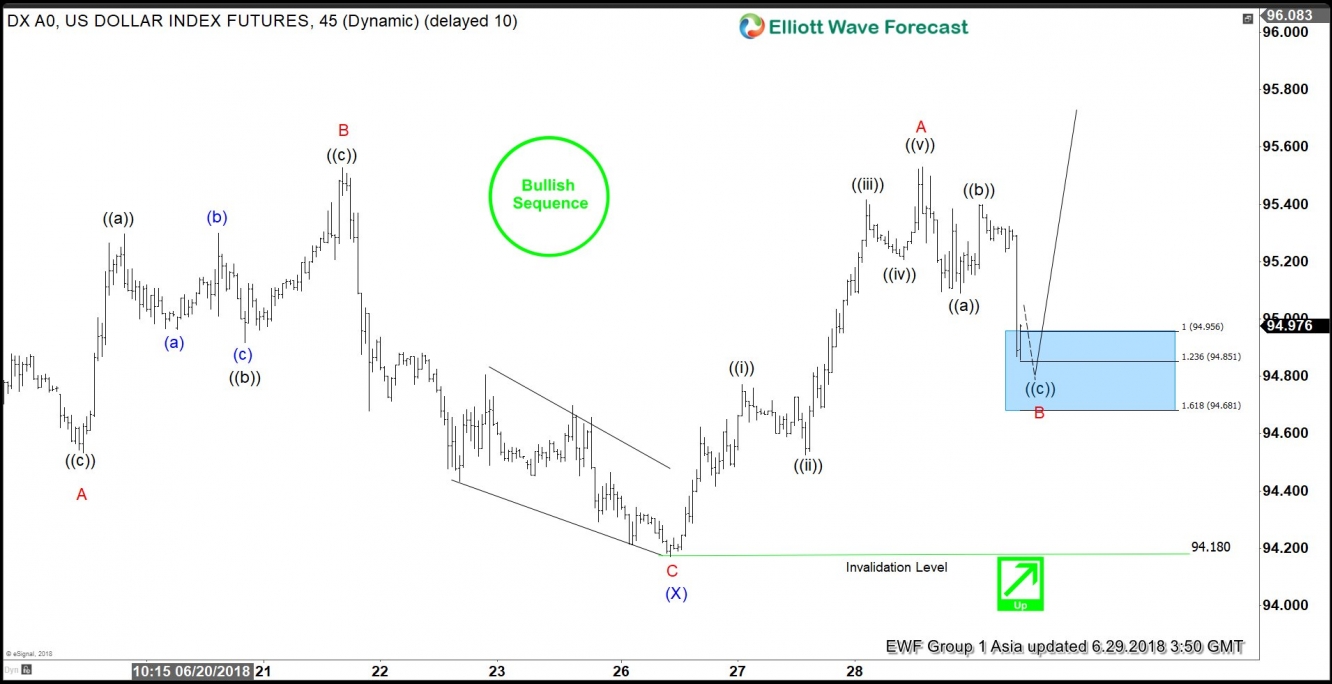
USDX short-term Elliott Wave view suggests that the decline to 94.18 on 6/25 low has ended correction to the cycle from 6/7/2018 low as Intermediate wave (X). The internals of that pullback unfolded as a Flat correction where Minor wave A ended in 3 swings at 94.53, Minor wave B ended in 3 swings at 95.52 and Minor wave C of (X) ended at 94.18 low.
Above from there, the rally is unfolded in 5 waves structure which ended Minor wave A of a Zigzag structure. Up from 94.18, Minute wave ((i)) ended at 94.77. Minute wave ((ii)) ended at 94.52, Minute wave ((iii)) ended at 95.41. Minute wave ((iv)) ended at 95.20, and Minute wave ((v)) of A ended at 95.53 high. The Index made a marginal new high above the previous irregular Minor wave B of (X) at 95.52, suggesting that the next extension higher in intermediate wave (Y) has started.
Down from 95.53 high, the index is pulling back in shorter cycles to correct cycle from 6/25 (94.18) within Minor wave B pullback. Near-term focus remains towards 94.68-94.85 100%-123.6% Fibonacci extension area of a Minute wave ((a))-((b)) to find buyers in the index either for new highs or for 3 wave reaction higher at least. We don’t like selling the index and expect buyers to appear in Minor wave B pullback in 3, 7 or 11 swings at the extreme area provided the pivot at 94.18 low stays intact.
USDX 1 Hour Elliott Wave Chart


