The U.S. dollar has been steadily climbing against the Turkish lira since 2008. Ten years later, in 2018, USD/TRY reached 7.1500 on the back of geopolitical tensions and President Erdogan‘s reckless political decisions. In May 2019, however, the pair was down to 6.0600 and it looked like the Lira’s plunge might be finally over.
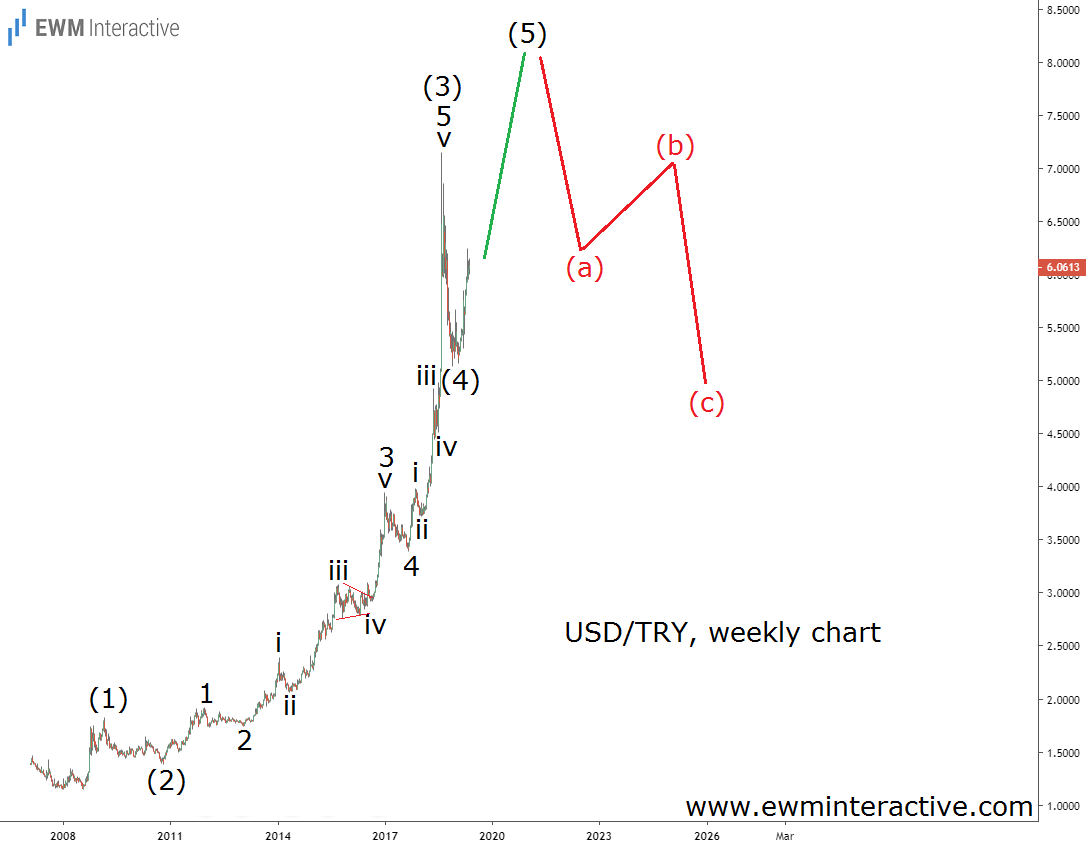
Unfortunately, our Elliott Wave analysis suggested otherwise. The chart below, published on May 27th, 2019, indicated that a new high can be expected before the uptrend finally ended.

Anticipating an impulse pattern to eventually form, we thought a new all-time high in wave (5) should occur. Wave (1) through (4) were already in place and two lower degrees of the trend were visible within the extended wave (3).
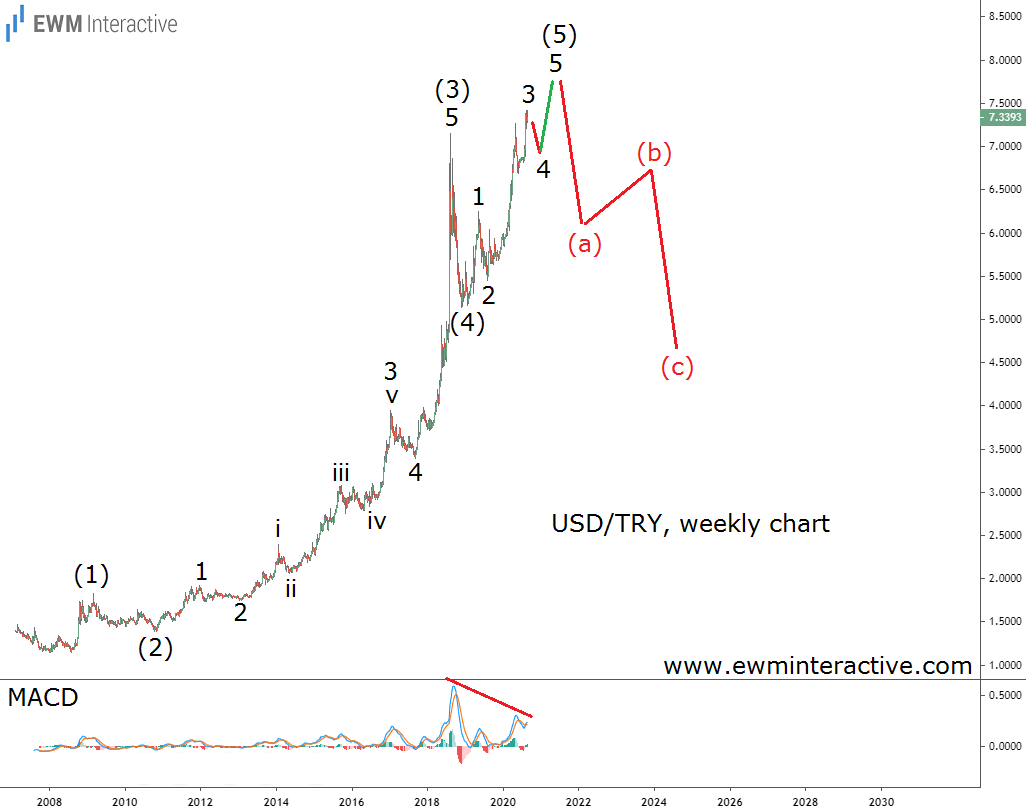
Fifteen months later now, USD/TRY closed slightly below 7.3400 after reaching 7.4200 last week. The new high we were expecting last year has now been reached. The updated chart below shows things have changed and what lies ahead.

The new high means there is probably not much left of wave (5). The bulls can still climb to the 8.0000 mark, but in our opinion, holding long positions is not worth the risk anymore. According to the Elliott Wave principle, once wave (5) is over, a major three-wave correction should follow.
The underlying weakness of the uptrend is highlighted by the MACD indicator. It reveals a bearish divergence between wave (3) and (5). USD/TRY made a new high in wave (5), but the MACD couldn’t. If this count is correct, USD/TRY’s 12-year uptrend might come to an end soon. A decline back to the support near 5.0000 seems likely.
