Turkey finally took a decisive step towards taming the double-digit inflation, which has been destroying the lira’s value for years. The country’s central bank lifted the benchmark interest rate to 15%, up 475 basis points from its previous standing. USD/TRY fell as low as 7.5031 earlier today, on track for a second consecutive week of losses.
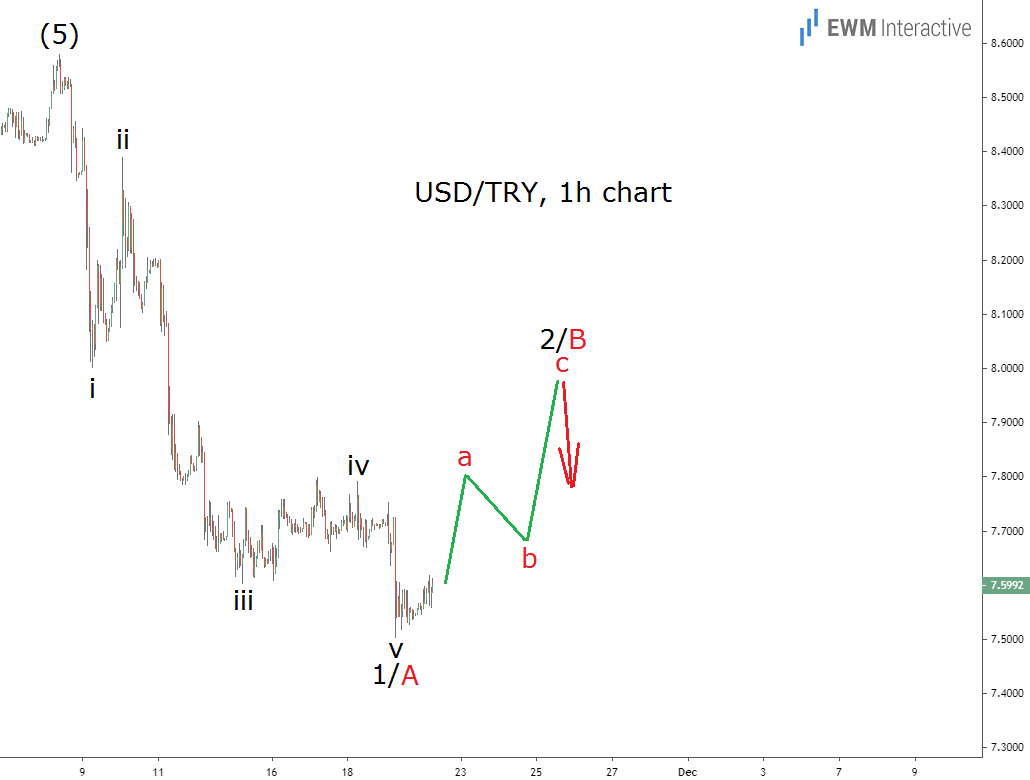
The pair turned south after 12 years of gains. This bearish reversal seems to be right on schedule, according to our big picture analysis, published late-August, even though it is a bit early to make that conclusion. USD/TRY ‘s hourly chart, however, looks very encouraging from a bearish standpoint. Take a look:

The pair’s decline from 8.58 to 7.50 so far this month looks like a textbook five-wave impulse. The pattern can be labeled i-ii-iii-iv-v in what should be either wave 1 or A of a larger structure. The Elliott Wave theory suggests we should expect a three-wave correction after every impulse.
In the case of USD/TRY, a corrective recovery in wave 2/B makes sense before the downtrend can resume in wave 3/C. This means a rally up to ~8.0000 makes sense in the short-term. As long as the pair trades below the starting point of wave 1/A, however, targets below 7.5000 remain plausible in wave 3/C. And if our big picture outlook is correct, the rate can go much further down in the long-term.
