
The U.S. dollar has been on a tear since the Financial crisis, rising against rivals both big and small. One currency that was hit especially hard is the Turkish lira. USD/TRY was down to less than 1.1500 in 2008. Ten years later, in August 2018, it slightly breached 7.1500.
Political and macroeconomic factors have certainly contributed to the Lira’s sharp devaluation. Fortunately, Elliott Wave patterns tend to form even under the most extraordinary circumstances. Let’s take a look at the chart of USDTRY below and see what we can expect next.
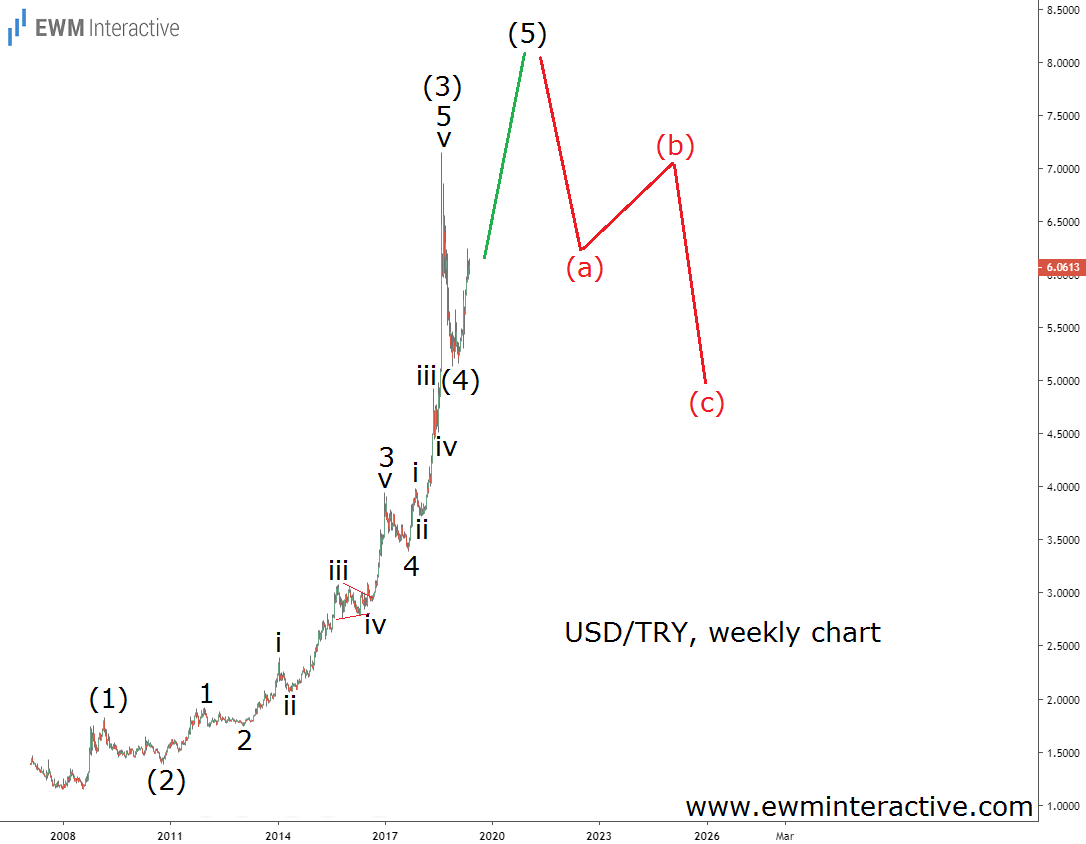
The weekly chart reveals the U.S. dollar’s meteoric rise against the Turkish lira since the bottom in August 2008. So far, we’ve seen waves (1)-(2)-(3) and (4). The five sub-waves of wave (3) are clearly visible and so is the impulsive structure of waves 3 and 5 of (3).
If this count is correct, wave (5) up is the last missing piece of the puzzle. It should be able to exceed the top of wave (3), making targets near 8.0000 very likely.
On the other hand, the Wave principle states that a three-wave correction in the opposite direction follows every impulse. This means a major bearish reversal can be expected once wave (5) completes the pattern. The anticipated (a)-(b)-(c) retracement is likely to erase all of wave (5)’s gains and reach the 5.0000 mark.