There has been a decent bullish run in the USD/SGD pair after it hit the critical support level at 1.3044. From that level, the bulls have taken control of this market and managed to rally higher breaking some minor resistance level. Most of the aggressive traders have already made a decent profit by executing long orders in the USDSGD pair with the formation of bullish price action signals right at the 1.3044 support level.
Since the pair is slowly heading towards the critical resistance level at 1.3956, most of the aggressive traders have already booked their profit. Currently, the pair trading at a critical zone and there is no valid trade setups to execute trades in the USDSGD pair. However, the current formations of the chart pattern strongly suggest an imminent breakout in the higher time frame. So, the retail traders are advised to wait on the sideline until they get a clear signal to trade this pair.
USDSGD technical chart analysis

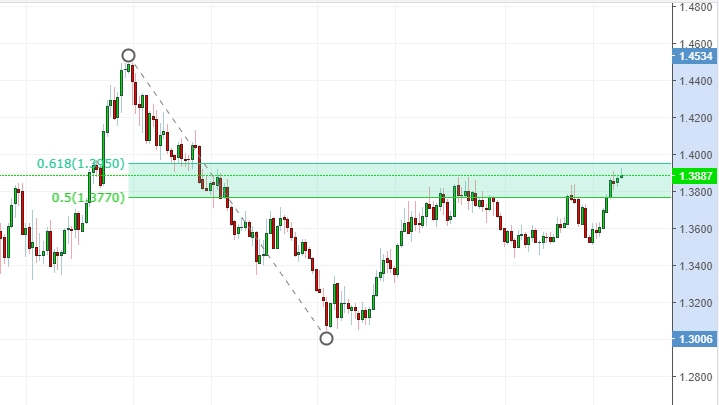
Figure: USDSGD heading towards the 61.8% bearish retracement level
From the above figure, you can see the price slowly heading towards the 61.8% retracement. This level is going to provide a significant amount of resistance to the USDSGD pair. Any bearish price action signal right at the 61.8% retracement level will be an excellent opportunity to execute short orders. According to professional traders in the CFD trading industry, executing short orders right at the critical resistance level at 1.3951 might offer decent profit-taking opportunity. On the contrary, a daily closing of the price above the 61.8% retracement level, will confirm the potential bottom formation right at the critical support level at 1.3465.
Bullish scenario
On the upside, the pair needs to clear the critical resistance at 1.3951 to establish fresh bullish momentum. A daily closing of the price above that level will eventually lead this pair towards the next critical resistance level at 1.4437. This level is going to provide a significant amount of resistance to this pair and any bearish price action confirmation signal will bring back the sellers. On the contrary, a clear break above the high of 1.4437 will refuel the bulls in the USDSGD pair.
Bearish scenario
On the downside, the initial bearish target for this pair lies at 1.3519. This level might provide some bullish bounce but a daily closing of the price below this level will result in a heavy fall. The pro traders will have a keen look at this level since this level might offer decent short profit-taking the opportunity to the retail traders. But a clear break of the critical support level at 1.3519 will eventually lead this pair towards the low 15th January 2018. Breaking below this level will be a tough task for the sellers since we have plenty of supportive candles just below this level.
Fundamental factors
The recent performance of the U.S economy clear shows the recovery phase for the green bucks. However, the last week consumer confidence data came out positive and it refueled the dollar bulls. But the long term investors are looking for a strong fundamental catalyst to assess the overall condition of the green bucks. So, we might exhibit ranging market in the USDSGD pair until the NFP data release which is scheduled on 6th September 2019.
On the other hand, the Singaporean economy is showing a great sign of recovery and have created a strong recovery attempt against most of its major rivals. So, chances are high we might see a decent bearish movement in the USDSGD pair in the upcoming week. However, the green bucks will regain its strength with strong news data and help the USDSGD pair to push higher. Considering the overall parameters of the market, it’s better to focus on the technical data to find out the best trading spots in the USDSGD pair.