🥇 First rule of investing? Know when to save! Up to 55% off InvestingPro before BLACK FRIDAYCLAIM SALE

USD/SGD Could Be Lining Up For A ‘Singapore Swing'

Published 09/13/2019, 08:03 AM
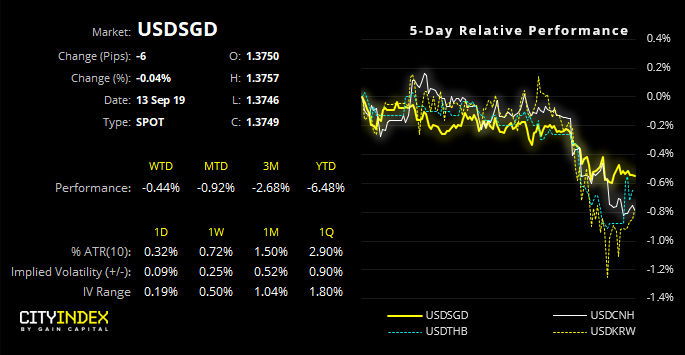
USD/SGD
-
USD/CNY
-
USD/SGD Chart

Having reached support, we’re looking for a potential swing trade short should a lower high form. Last week we highlighted the potential for the Yuan appreciate and suggested a bearish theme for USD/SGD as it correlates very well with USD/CNY. Since the original analysis, the Yuan has strengthened, which has seen USD/CNY fall over 1% and USD/SGD track it lower.

Given that trade tensions have continued to thaw, talks are back on and both US and China are seemingly exchanging good will gestures ahead of China’s 70th birthday celebrations, it’s likely Beijing (sorry.. the ‘markets’) will continue to allow the Yuan to appreciate. Which keeps the bearish UD/SGD theme on the table
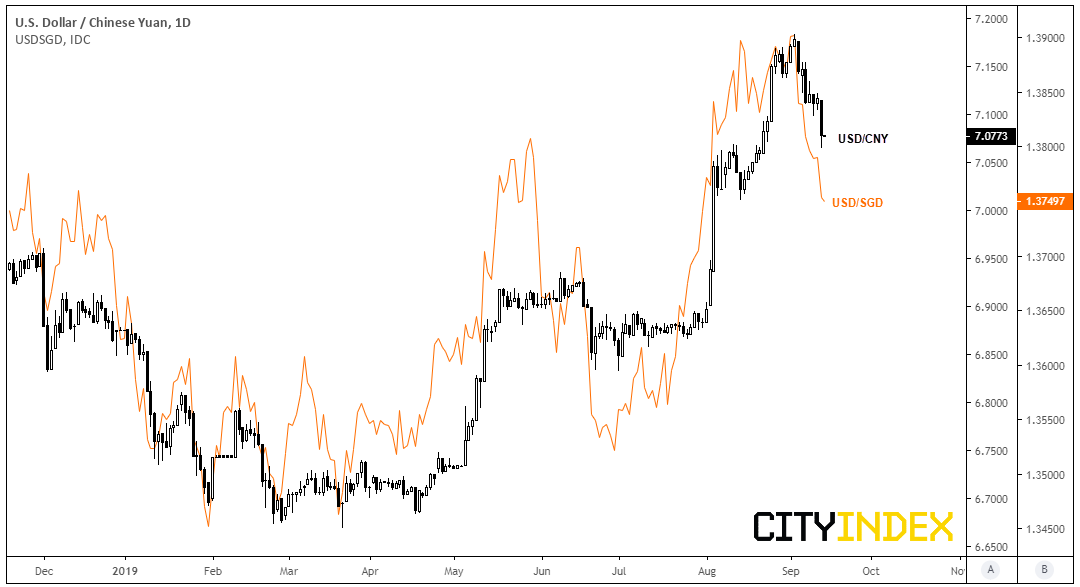
USD/Yuan Daily Chart

We can see on the daily chart that USD/SGD’s decline has found support just above the 1.3114/24 support zone. As of yesterday’s close, bears have enjoyed 8 consecutive down days, making it the longest daily bearish streak since January 2018. Therefor it’s possible we could see prices consolidate or retrace before its next leg lower. However, RSI is not oversold and there are no signs of a bullish divergence on this timeframe, so we suspect there is plenty of downside potential should it break below 1.3700.

Interestingly, the decline from September’s high displays a similar velocity to the initial leg lower from the May high. If history were to repeat and maintain a similar structure to the 3-wave move in June, we could see prices rebound to 1.3825 before falling down towards 1.3620. Of course, as the saying goes “history doesn’t repeat but it does rhyme”, it’s unlikely we’ll get an identical move. But we can monitor to see if prices form a lower high before considering a swing trade short, or wait for prices to break below support before assuming a run for the 1.3620 area.
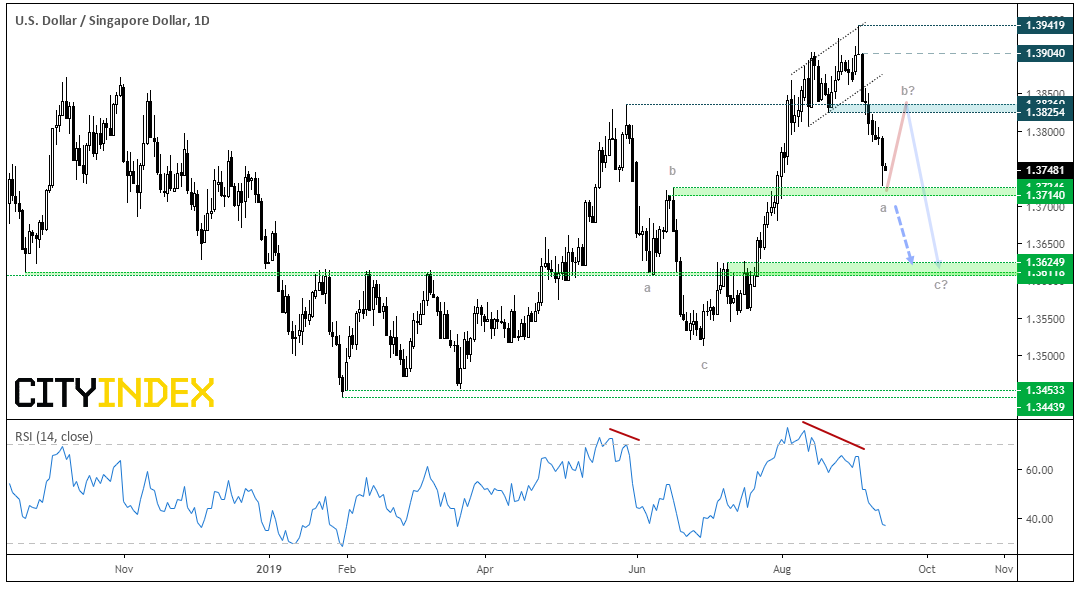
USD/SGD Daily Chart

Original Post

Latest comments

Loading next article…
Risk Disclosure: Trading in financial instruments and/or cryptocurrencies involves high risks including the risk of losing some, or all, of your investment amount, and may not be suitable for all investors. Prices of cryptocurrencies are extremely volatile and may be affected by external factors such as financial, regulatory or political events. Trading on margin increases the financial risks.
Before deciding to trade in financial instrument or cryptocurrencies you should be fully informed of the risks and costs associated with trading the financial markets, carefully consider your investment objectives, level of experience, and risk appetite, and seek professional advice where needed.
Fusion Media would like to remind you that the data contained in this website is not necessarily real-time nor accurate. The data and prices on the website are not necessarily provided by any market or exchange, but may be provided by market makers, and so prices may not be accurate and may differ from the actual price at any given market, meaning prices are indicative and not appropriate for trading purposes. Fusion Media and any provider of the data contained in this website will not accept liability for any loss or damage as a result of your trading, or your reliance on the information contained within this website.
It is prohibited to use, store, reproduce, display, modify, transmit or distribute the data contained in this website without the explicit prior written permission of Fusion Media and/or the data provider. All intellectual property rights are reserved by the providers and/or the exchange providing the data contained in this website.
Fusion Media may be compensated by the advertisers that appear on the website, based on your interaction with the advertisements or advertisers.
© 2007-2024 - Fusion Media Limited. All Rights Reserved.