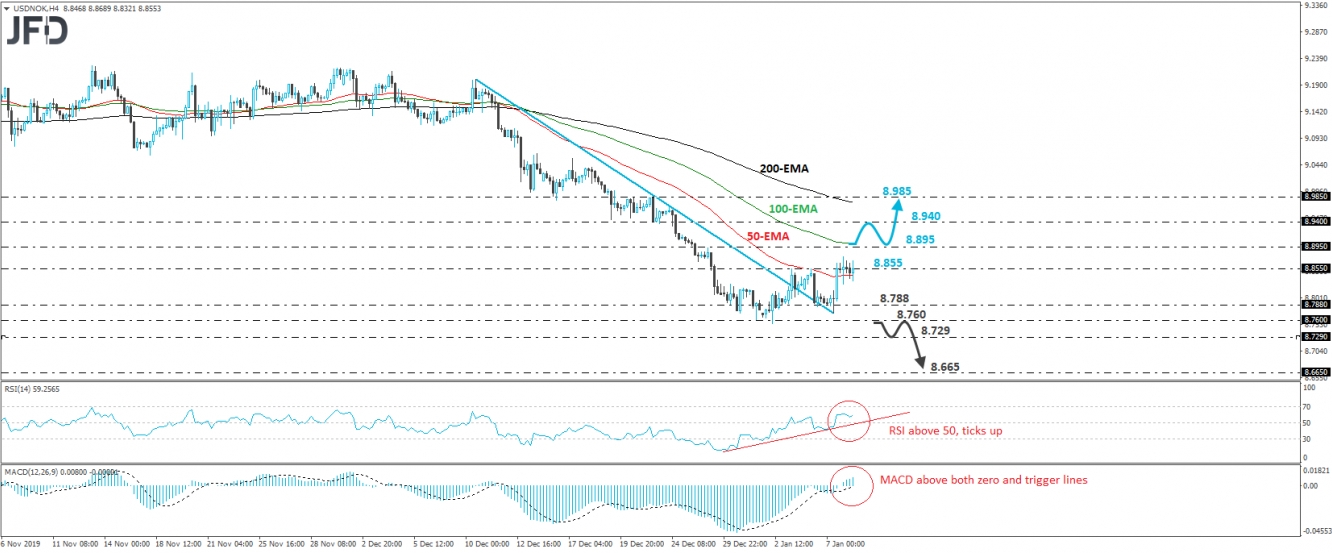
USD/NOK traded higher yesterday, after hitting the prior downtrend line that’s been taken from the high of December 10th. That said, the advance was stopped near the peaks of January 3rd and 6th, at around 8.855, and then, it started oscillating around that barrier. As long as the rate is trading above the aforementioned downside line, we would consider the short-term outlook to be slightly positive and we would expect the bulls to refuel at some point soon.
If they do so, they could soon aim for the 8.895 level, marked by the high of December 27th. A break above that zone may pave the way towards the 8.940 area, defined by the inside swing low of December 23rd. Another break, above 8.940, could extend the advance towards the peak of that day, at around 8.985.
Shifting attention to our short-term oscillators, we see that the RSI stands above its 50 line, and has just ticked up, while the MACD lies above both its zero and trigger lines, pointing north as well. Both indicators detect positive momentum and support the case for this exchange rate to drift somewhat further north.
On the downside, we would like to see a decisive dip below 8.760 before we start examining whether the prior downtrend has resumed. Such a move would confirm a forthcoming lower low on the 4-hour chart and could initially aim for the 8.729 barrier, marked by the highs of July 26th and 29th. A break lower could carry more bearish implications, perhaps paving the way towards the lows of those days, near 8.665.

