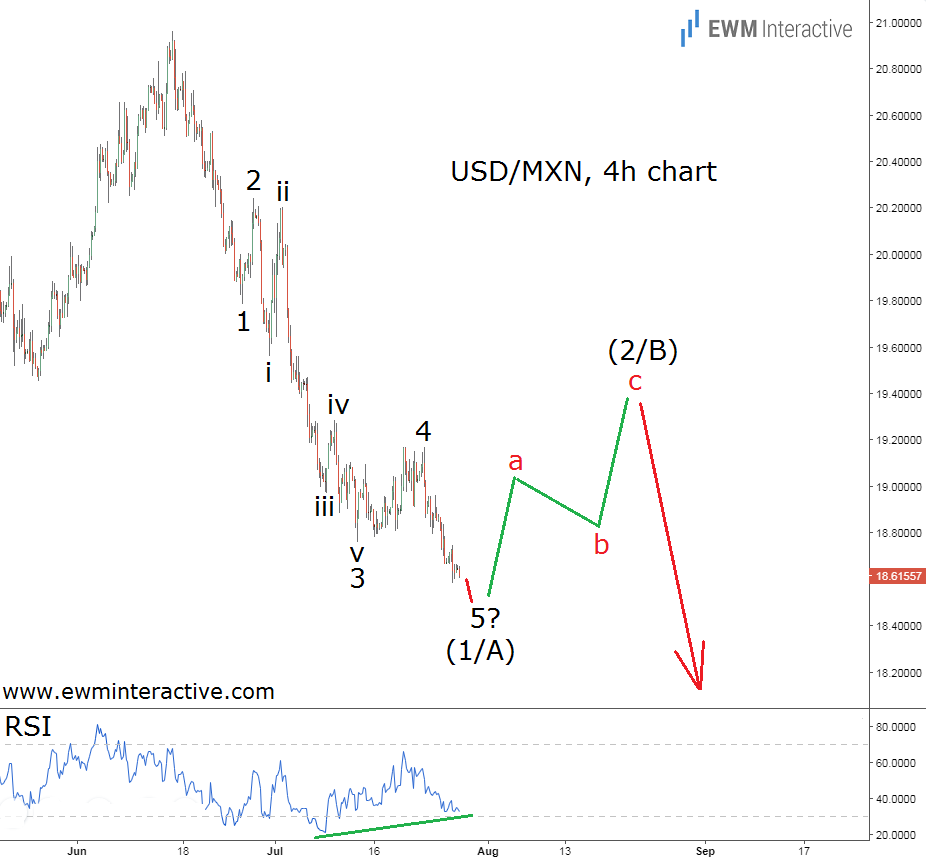
It has been a painful month and a half for USD/MXN bulls. The pair was almost touching the 21.00 mark on June 15th, when the bears returned with a vengeance to drag it to as low as 18.58 for an 11.3% plunge by July 26th. Some explain the strength of the Mexican Peso with the upbeat inflation data from Mexico and the interest rate hike by the Bank of Mexico on July 9th. This, unfortunately, does not tell us anything about the pair’s next move, so once again we will take a look at USD/MXN’s price chart and see if the market has left us a hint there.

The 4-hour chart shows that USDMXN’s drop from 20.96 has the structure of a five-wave impulse, labeled 1-2-3-4-5, where wave 3 is extended. According to the Elliott Wave Principle, impulses indicate the direction in which the larger trend is going. On the other hand, every impulse is followed by a correction of three waves in the opposite direction before the trend resumes.
In our case this tell us that: 1) a three-wave recovery should soon be expected, but 2) USD/MXN remains under bearish jurisdiction and once wave (2/B) is over the bears are going to drag the pair to a new low in wave (3/C). The short-term positive outlook is also backed up by the Relative Strength Index, which reveals a bullish divergence between the lows of waves 3 and 5 of (1/A).
Now, picking a bottom is never a good idea, but this count suggests a corrective rally to 19.50 – 20.00 is about to interrupt the downtrend in the near future. The big picture outlook remains negative, as long as USD/MXN trades below the key level of 20.96.
