💥Fed cuts sparks mid cap boom! ProPicks AI scores with 4 stocks +23% each. Get October’s update first.Pick Stocks with AI

USD/MXN And USD/TRY Analysis For May 18, 2018

Published 05/18/2018, 08:11 AM
Updated 03/21/2024, 07:45 AM
USD/TRY
-
USD/MXN
-
DX
-

Mexican Peso

The {{|Mexican Peso}} (MXN) has continued to weaken on uncertainty surrounding the North American Free Trade Agreement (NAFTA), where there is still no deal in sight. Even if the government announces an agreement on NAFTA, any recovery may be short-lived, as attention will turn to the country’s election where the favoured candidate, Manuel Lopez Obrador, is expected to reduce efforts to open up the oil industry and generate growth.

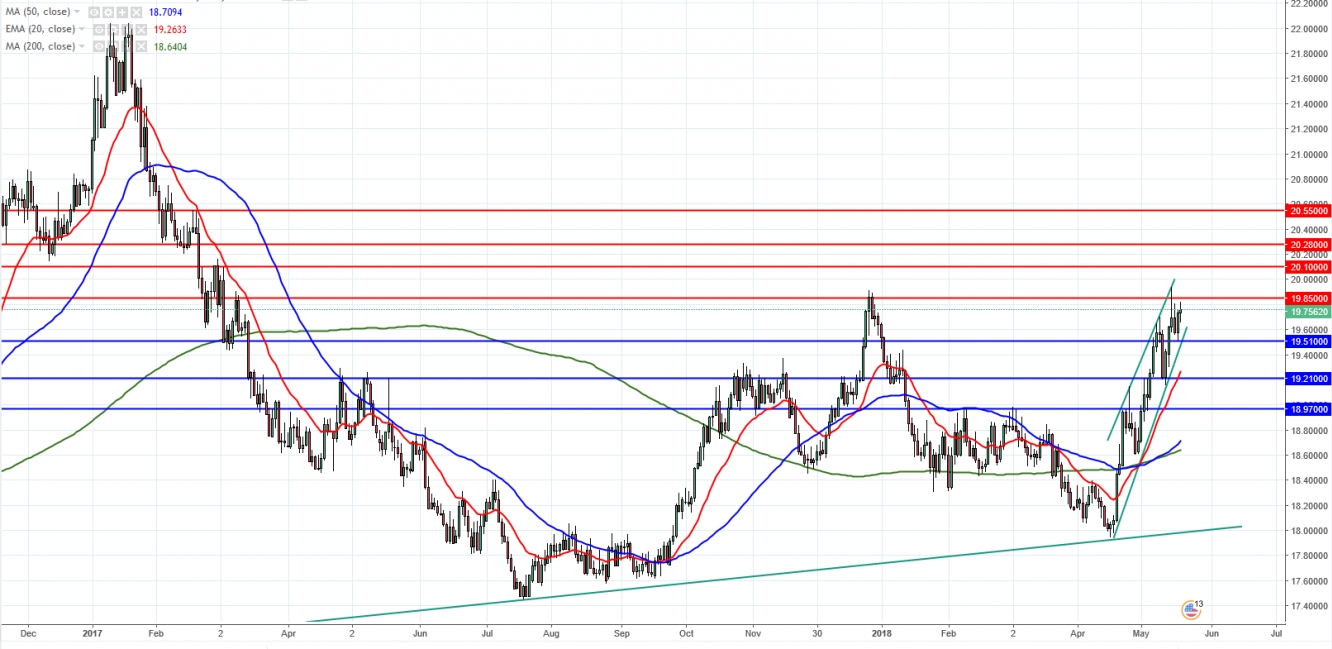
On the daily chart, USD/MXN has again stalled at 19.85 near the 50% retracement of the highs of 2017. A break of this level is needed for continued upside towards the 61.8% retracement at 20.28, with immediate resistance at 20.10. A reversal and break of 19.51 will find downside support at 19.21 and then 18.97.

USDMXN Daily chart

Turkish Lira

The USD/TRY pair has suffered from the sharp rally in the US Dollar brought on by higher U.S. interest rates. The Turkish economy is in the grips of rampant inflation and, because it imports most of its oil, the rising cost of energy is creating price pressure. Inflation is currently exceeding Turkey’s interest rates of 8%. Moreover, political problems and the independence of the Central Bank of Turkey (CBT) have become a concern. It is possible that, at some point, the CBT will be given control and will raise interest rates to curb inflation and strengthen the Lira.

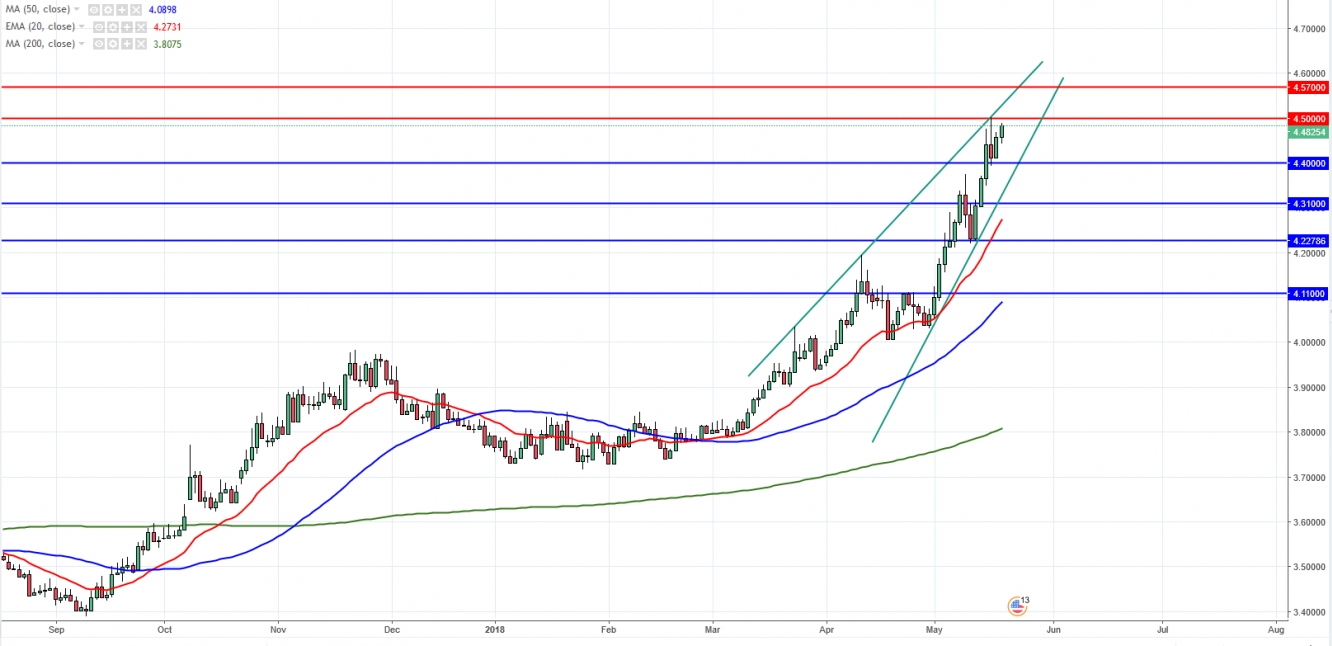
In the daily timeframe, USD/TRY is trading in a possible ascending wedge. A break of the highs at 4.50 could lead to further upside to resistance at 4.57, which is an equal measured move of the previous move from 30 April. A continuation above 4.57 would see the pair accelerate above 4.60. A reversal and break of 4.40 would open the way for a move towards 4.31, with a break of the ascending wedge signalling the start of a deeper correction.

USDTRY Daily chart

By Edward Anderson, Financial Analyst, Forex Broker, FxPro

Latest comments

Loading next article…
Risk Disclosure: Trading in financial instruments and/or cryptocurrencies involves high risks including the risk of losing some, or all, of your investment amount, and may not be suitable for all investors. Prices of cryptocurrencies are extremely volatile and may be affected by external factors such as financial, regulatory or political events. Trading on margin increases the financial risks.
Before deciding to trade in financial instrument or cryptocurrencies you should be fully informed of the risks and costs associated with trading the financial markets, carefully consider your investment objectives, level of experience, and risk appetite, and seek professional advice where needed.
Fusion Media would like to remind you that the data contained in this website is not necessarily real-time nor accurate. The data and prices on the website are not necessarily provided by any market or exchange, but may be provided by market makers, and so prices may not be accurate and may differ from the actual price at any given market, meaning prices are indicative and not appropriate for trading purposes. Fusion Media and any provider of the data contained in this website will not accept liability for any loss or damage as a result of your trading, or your reliance on the information contained within this website.
It is prohibited to use, store, reproduce, display, modify, transmit or distribute the data contained in this website without the explicit prior written permission of Fusion Media and/or the data provider. All intellectual property rights are reserved by the providers and/or the exchange providing the data contained in this website.
Fusion Media may be compensated by the advertisers that appear on the website, based on your interaction with the advertisements or advertisers.
© 2007-2024 - Fusion Media Limited. All Rights Reserved.