⭐ Start off 2025 with a powerful boost to your portfolio: January’s freshest AI-picked stocksUnlock stocks

USD/MXN Analysis – June 12, 2018

Published 06/12/2018, 05:38 AM
Updated 03/21/2024, 07:45 AM
USD/MXN
-

The G7 Summit deepened the rift between the US and its closest allies with Canada taking the brunt of the damage. What the fallout for NAFTA will be remains to be seen. The impact on Mexico also remains unclear with the USD/MXN pair cycling between 20.64168 and 20.20390. The market moved higher since the April low and rallied above 20.00000 on the lead into the meetings. Resistance at 20.64168 has been tested and 21.00000 remains the next area where sellers could be waiting. Further on the 21.38828 corresponds to the late 2016 high with a double top formed at 22.02739.

Support for the pair is found at 20.20390 as mentioned earlier, with the 20.00000 level close by. The 19.90000 level was the high from December 2017 and a loss of this point could see longs come under pressure and the trend tested. To build on such a move sellers would need to take out 19.43914 and the 50 DMA followed by the 100 DMA at 19.14253 creating lower lows in the process. The support of the 200 DMA and the 18.95150 level could be used by longs to prop up price but a loss of these levels could target 18.43770 and 18.04950 as supports.
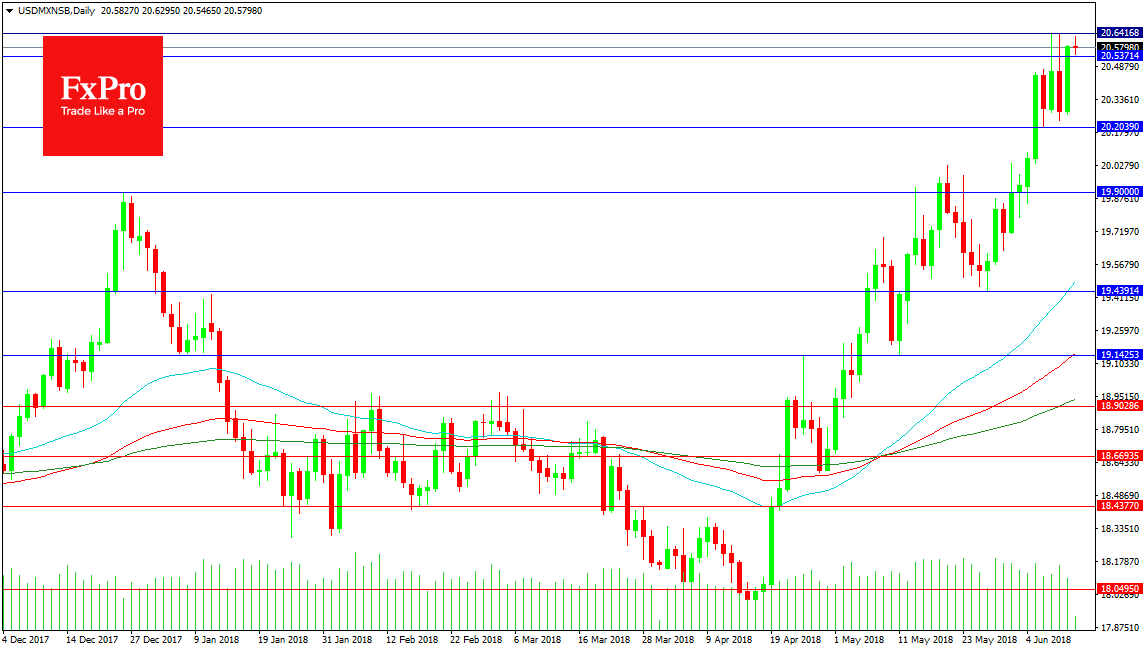
USD/MXN SB Daily Chart


For more in-depth analysis and market forecasts visit our the FxPro Blog.

Latest comments

Loading next article…
Risk Disclosure: Trading in financial instruments and/or cryptocurrencies involves high risks including the risk of losing some, or all, of your investment amount, and may not be suitable for all investors. Prices of cryptocurrencies are extremely volatile and may be affected by external factors such as financial, regulatory or political events. Trading on margin increases the financial risks.
Before deciding to trade in financial instrument or cryptocurrencies you should be fully informed of the risks and costs associated with trading the financial markets, carefully consider your investment objectives, level of experience, and risk appetite, and seek professional advice where needed.
Fusion Media would like to remind you that the data contained in this website is not necessarily real-time nor accurate. The data and prices on the website are not necessarily provided by any market or exchange, but may be provided by market makers, and so prices may not be accurate and may differ from the actual price at any given market, meaning prices are indicative and not appropriate for trading purposes. Fusion Media and any provider of the data contained in this website will not accept liability for any loss or damage as a result of your trading, or your reliance on the information contained within this website.
It is prohibited to use, store, reproduce, display, modify, transmit or distribute the data contained in this website without the explicit prior written permission of Fusion Media and/or the data provider. All intellectual property rights are reserved by the providers and/or the exchange providing the data contained in this website.
Fusion Media may be compensated by the advertisers that appear on the website, based on your interaction with the advertisements or advertisers.
© 2007-2025 - Fusion Media Limited. All Rights Reserved.