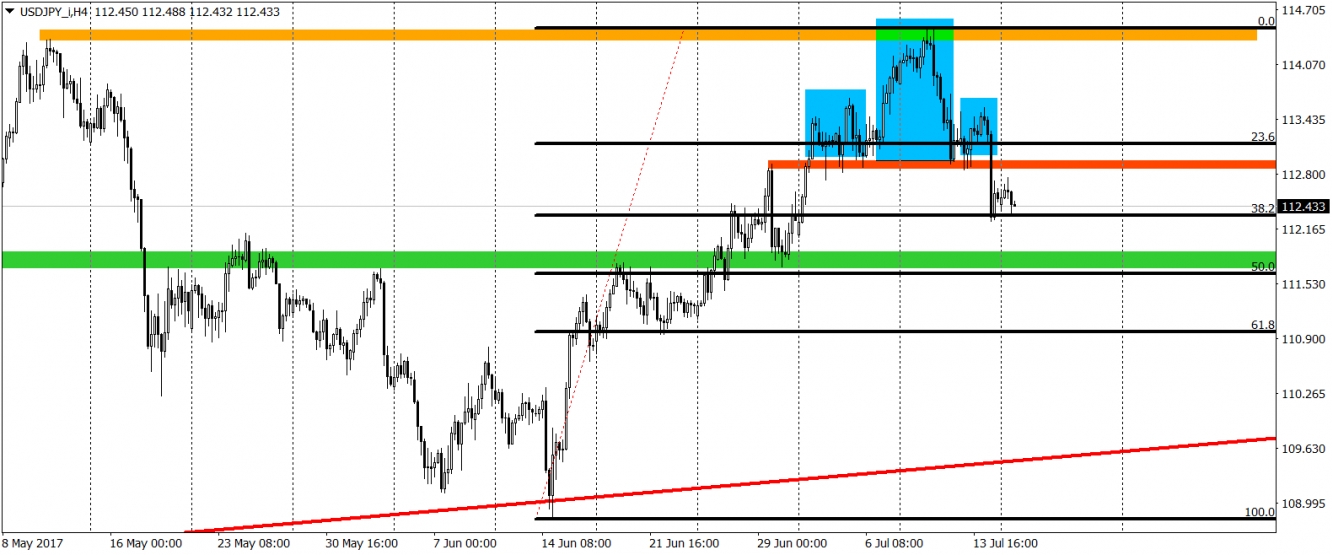
Selling USD now seems obvious. On the other hand, buying in the same time JPY does not sound like a good idea. We do have a positive sentiment on stocks, traders are good with the risk and are escaping from save heaven assets. So why the idea behind this analysis is to look negatively on the USD/JPY? We will try to explain that using the best tools from the technical analysis.
First of all we do have a nice reversal pattern here, head and shoulder (blue lines). Formation is active as the neckline was already broken (red). The potential target for this movement is the green area, which in my opinion can be a strong support. Why do I think that? Well just look on the chart since the beginning of February and you will see that this area was used as a S/R multiple times. The only obstacle here now is the 38,2% Fibonacci level (current local support) but I think that the gravity will do the job here and the price will decline 60-70 pips lower.
What will happen after that depends from the price action on this level. Generally I would not be surprised if we would touch the red line which is a long-term dynamic support connecting higher lows from April and June. But for that we still do have a lot of time and I would love to see more pessimistic arguments on the chart before going full bear.

