A recent downturn for the USD/JPY is signalling that the pair’s recent bullishness might be about to end as the long-term bearish trend resumes. Specifically, another divergence and some compelling EMA activity could be hinting that the pair is set to seek out support as low as the 106.00 handle. Additionally, recent Parabolic SAR indicator activity could be signalling that the last few session’s tumbles are the beginning of a more serious plunge.
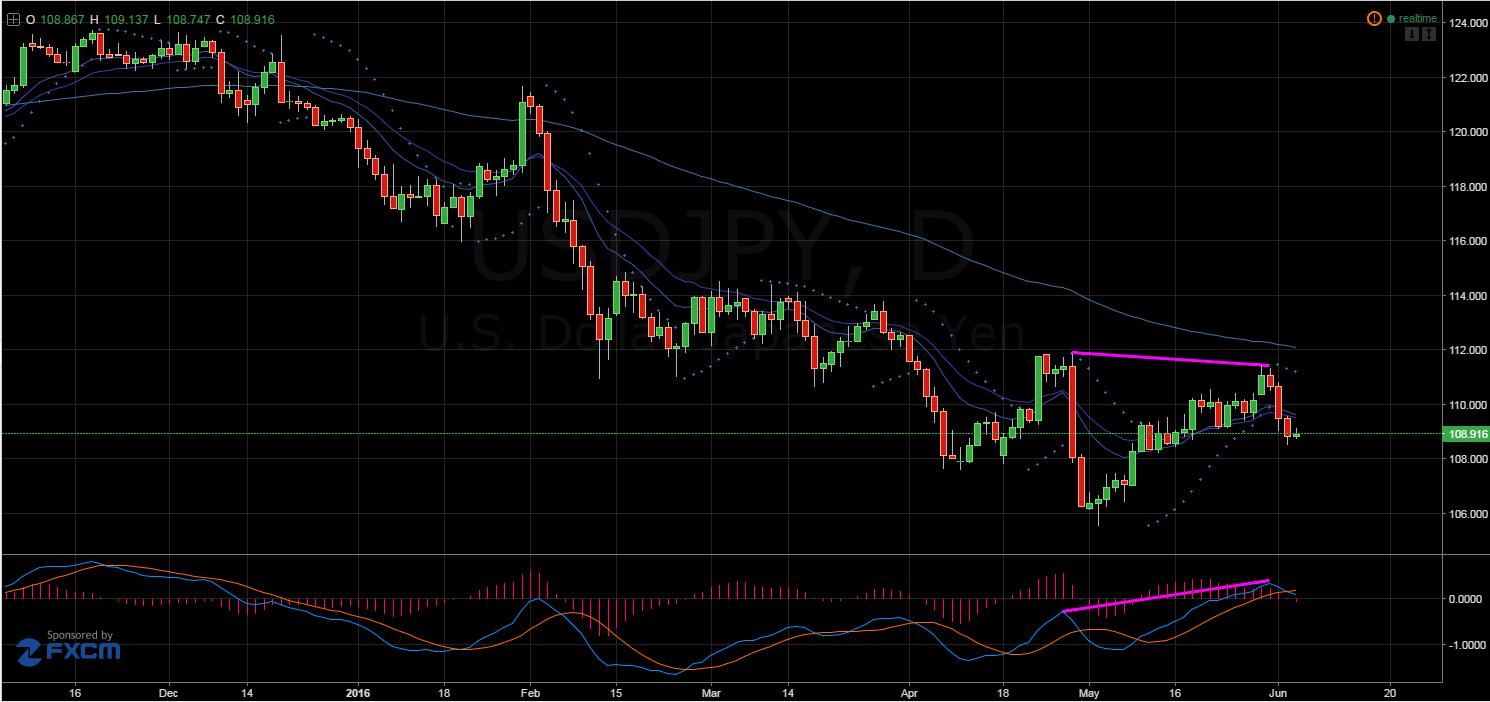
Firstly, on the daily chart, a MACD divergence has recently taken place which has kicked off the recent downturn. The divergence signals that, despite appearing bullish, there is an underlying weakness in the pair. Consequently, it comes as little wonder that the dollar-yen took a slide over the past number of sessions.

However, the recent slides may not be the full extent of the downside potential for the pair. The Parabolic SAR indicator has now moved above the candles which could mean a strong trend reversal has occurred. Last time this happened, we saw the USD/JPY plummet all the way to the 106.00 handle. Consequently, any traders still bullish on this pair may want to take notice.
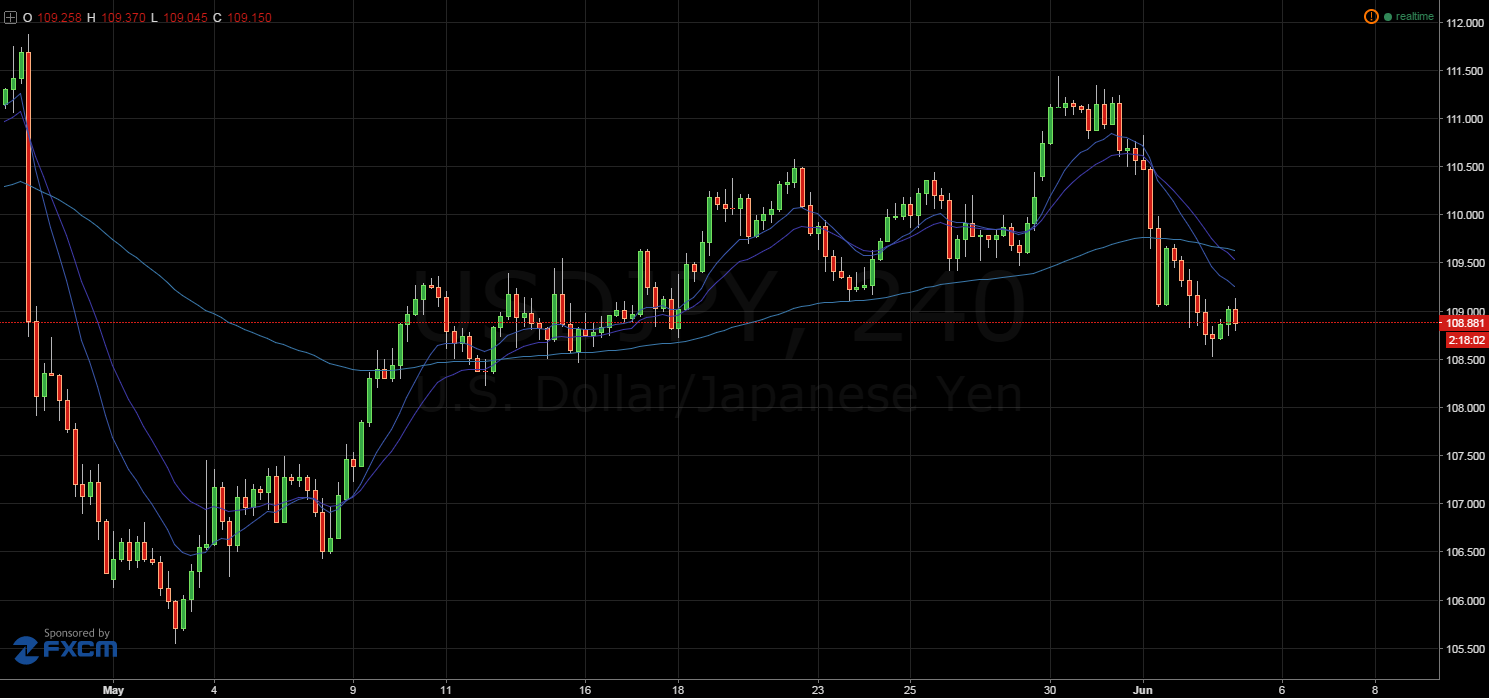
Aside from a MACD divergence and a Bearish Parabolic SAR indicator, EMA activity remains highly bearish in both the long run and now the short run as well. Specifically, the 100 day EMA is still pressing relentlessly lower despite the temporary bullishness of the pair. Moreover, a recent crossover of the 100 period EMA with the 12 and 20 period EMAs on the H4chart is hinting at some strong downside potential in the near future.

Furthermore, the recent pause in the pair’s plummet likely comes as a result of an oversold stochastic oscillator. Consequently, the USD/JPY could resume its descent next week after it has taken a small breather. However, keep watch for the US fundamentals due out as the trading week finishes up as they could see the pair slide lower before the week is done.
Ultimately, the USD/JPY will need some substantial improvement in the US results before making any true recovery. Consequently, recent bullishness is more likely a reaction to Fed jawboning and the thin chance of a US rate hike. Moreover, the technicals are now pointing to a likely continuation of the long-term bearish trend which could see the pair flirting with the 106.00 handle once again. As a result, keep a close watch on the US fundamentals in coming weeks as they are likely to be the real signal that the dollar-yen will finally break the 111.00 zone of resistance.
