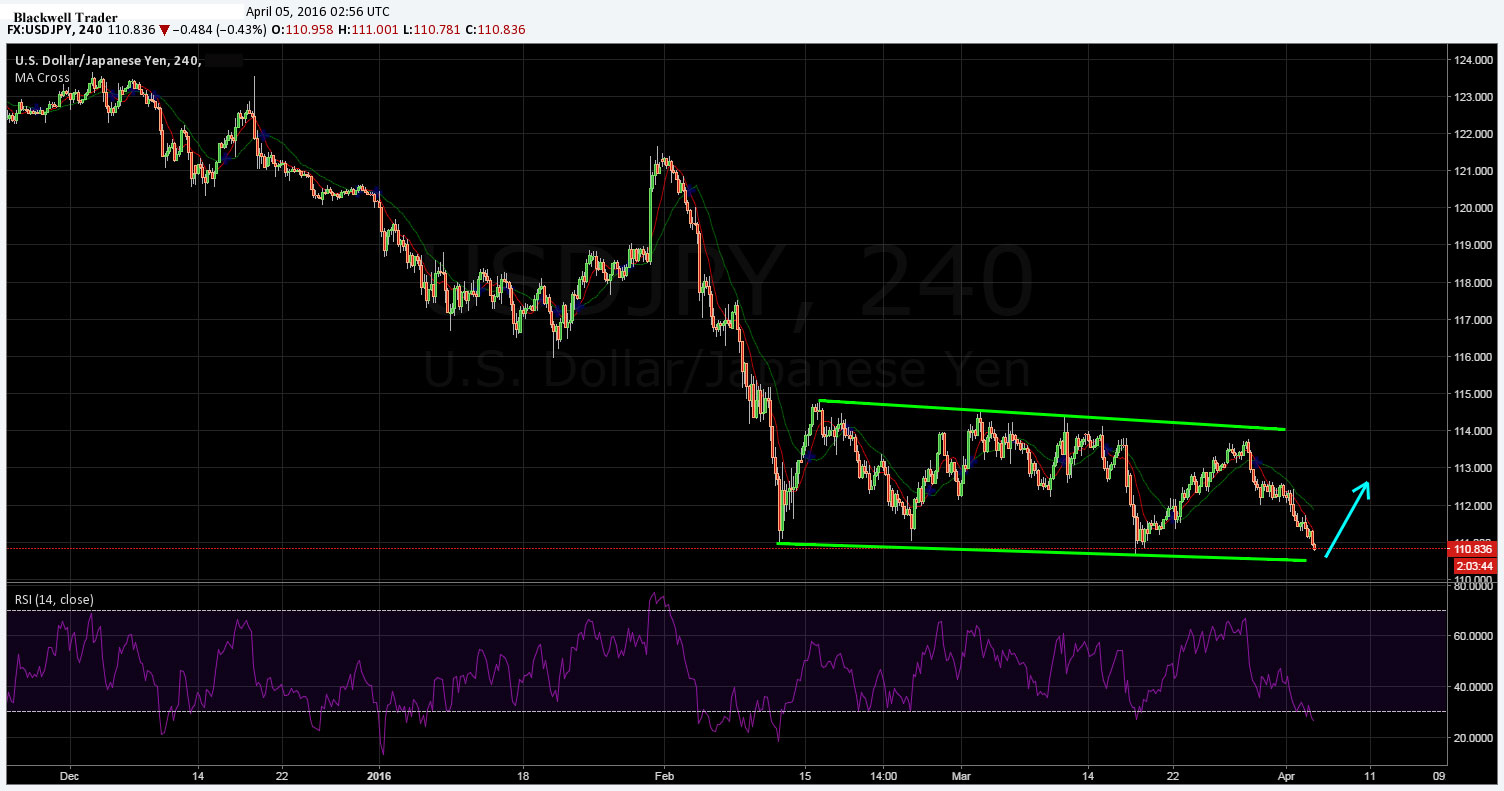
The USD/JPY has been relatively determined in its recent resolve to move lower and test the key 110.50 support level. However, despite the growing dollar bearishness, the downside is likely to be relatively limited for the pair.
The past few days have seen the Yen appreciating sharply against the US dollar, as a bevy of negative sentiment eroded any gains from the strong US Non-Farm Payroll result. Subsequently, it would appear that the broad negative move against the US dollar cross pairs was mainly due to changing rhetoric from the US Federal Reserve.
In addition, further complicating the fundamental analysis is a range of mixed Japanese economic data with the Average Cash Earnings figures, a strong indicator of wage growth, rising from 0.4% to 0.9% y/y. In contrast, the Bank of Japan’s Tankan index, which models corporate price expectations, fell sharply from 12.0 to 6.0. Additionally, it would appear that the central bank’s inflationary expectations have also diminished in the near term. There is, therefore, a very mixed picture emanating from the Japanese economy, albeit biased to the negative.
Subsequently, it would appear that the ongoing selling of the dollar is largely overshadowing much of the negative indicators emanating from Japan and thereby depressing the USD/JPY’s valuation. However, whilst the market may still be adjusting to the Fed’s current outlook, the re-balancing of expectations is likely near to completion. Therefore, don’t expect the pair to continue declining forever.
In fact, there are some technical indications that the USD/JPY’s recent demise could be coming to a close, as the 4-Hour chart shows the RSI Oscillator entering in to oversold territory. In addition, the stochastic indicator is also showing a reversal status which seems to indicate that, at the very least, a corrective reversal is in order.

Taking a look at the recent price action also provides some interesting visual cues as it is clear that the pair has been trapped within a channel since early February. Subsequently, as the key 110.50 support level comes into play, so too does the bottom of that channel. There is therefore plenty of stiff support in the current price range that would make any push towards the 110.00 handle problematic.
Ultimately, the most likely scenario in the coming session is that the pair forms another bottom right at the convergence of the channel and support at 110.50, before commencing a reversal and rally back towards the 111.50 mark. Over the past few months the same trade setup has produced some quick reversals from between 110.50 and 111.00 and this pattern is likely to repeat itself. So watch the pair closely over the next session as there is likely to be a dramatic move one way or another.

