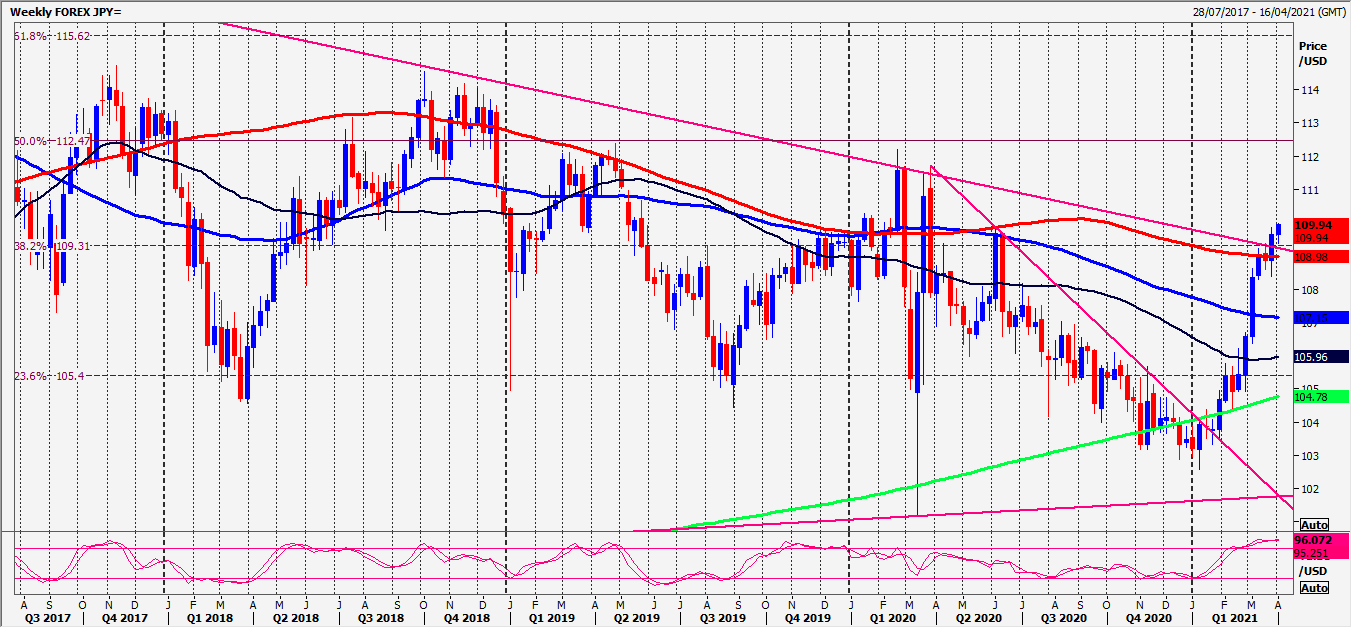
USDJPY strong support at 109.00/108.95 marked a low for the week as expected. On Friday we bounced as expected to 109.40/50 initially, then our targets of 109.70/75 & 109.95/110.05 as predicted. We topped exactly here.
EURJPY beat minor resistance at 130.20/30 & topped exactly at strong resistance at the March high at 130.55/65.
CADJPY topped exactly at strong resistance at 8755/65. Obviously this is key to direction on the open.
Today’s Analysis
USDJPY topped exactly at our target for the day at 109.95/110.05. Watch for a sideways trend to develop. Minor support at 109.50/40 but below here can retest strong support at 109.00/108.95, Watch for a low for the day. A break below 108.85 however risks a slide to 108.40, perhaps as far as 107.90/70.
Minor resistance at 109.95/110.05. Strong resistance at 110.10/20. Shorts need stops above 110.30. A break higher targets 110.55/65 before a retest of the April high of 110.85/95.
EURJPY holding strong resistance at the March high at 130.55/65 leave s a negative double top in place targeting 130.30/20, perhaps as far as first support at 129.75/65.
Below 129.55 meets strong support at 129.35/25. A break below 129.15 risks a slide to strong support at 128.60/50.
Strong resistance at the March high at 130.55/65. A break above 130.75 is obviously a positive signal but we run in to important 15 month trend line resistance at 131.25/35.
CADJPY topped exactly at strong resistance at 8755/65. Shorts need stops above 8775. A break higher targets 8790/8800 before a retest of the high at 8820/30.
Holding strong resistance at 8755/65 targets 8720/10, perhaps as far as 8695/85. Strong support at 8650/30. Watch for a low for the day. A break below 8620 risks a slide to 8605/00 then 8580/70.
No representation or warranty is made as to the accuracy or completeness of this information and opinions expressed may be subject to change without notice. Estimates and projections set forth herein are based on assumptions that may not be correct or otherwise realised. All reports and information are designed for information purposes only and neither the information contained herein nor any opinion expressed is deemed to constitute an offer or invitation to make an offer, to buy or sell any security or any option, futures or other related derivatives.
Chart

