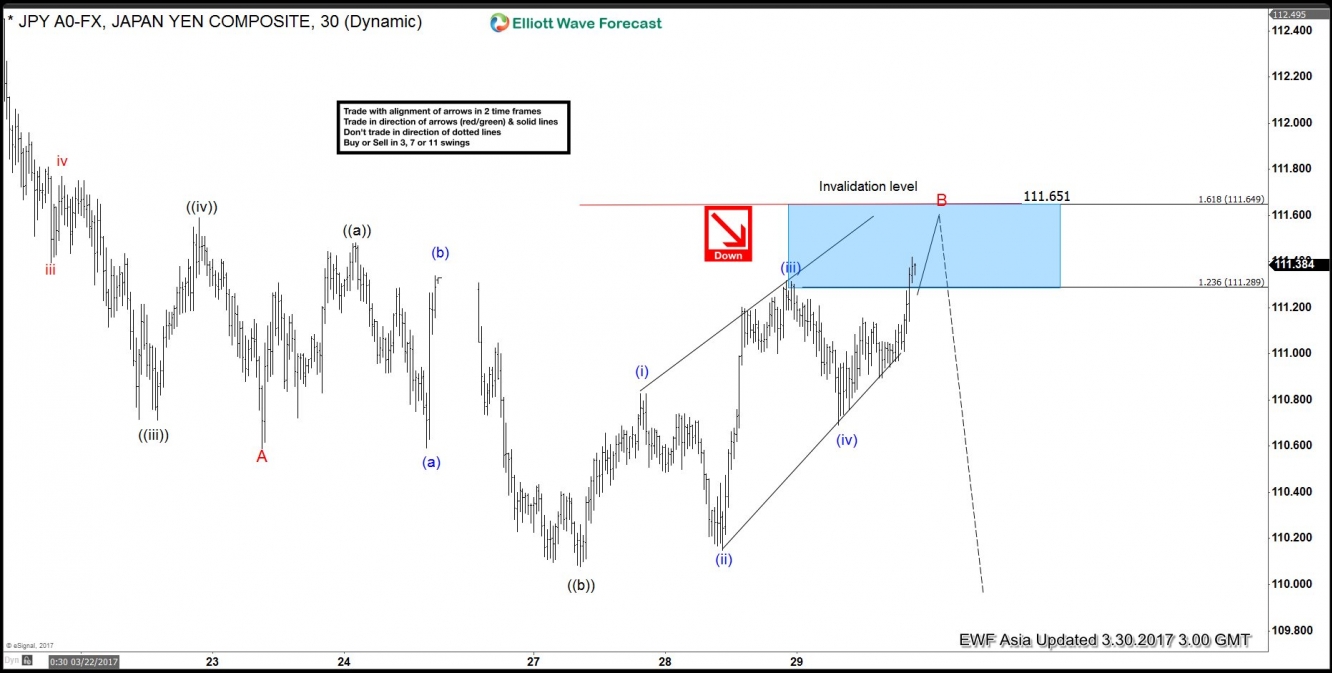
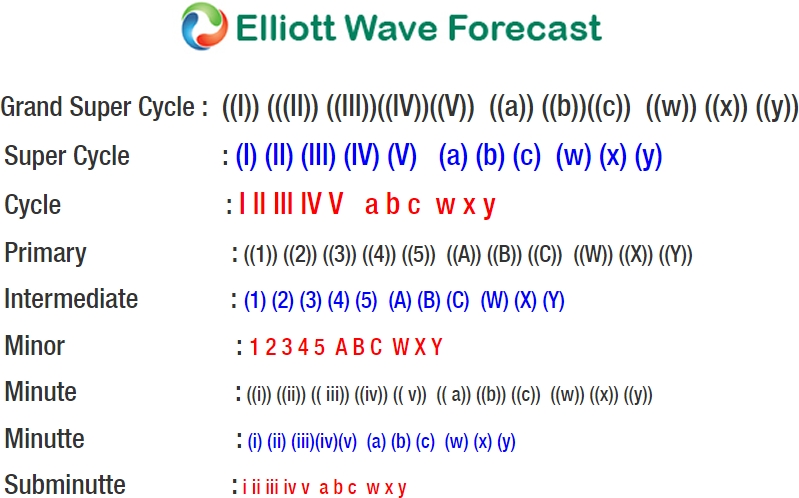
Short term Elliott Wave view in USD/JPY suggests that cycle from 3/10 peak (115.53) has ended with Minor wave A at 110.589. Decline from 115.53 is unfolding as a 5 waves impulse Elliott wave structure with an extension where Minute wave ((i)) ended at 114.46, Minute wave ((ii)) ended at 115.19, Minute wave ((iii)) ended at 110.7, Minute wave ((iv)) ended at 111.59, and Minute wave ((v)) of A ended at 110.59. USD/JPY ended cycle from 3/10 peak and correcting that cycle in wave B bounce in 3, 7, or 11 swing.
Wave B bounce is unfolding as an Expanded Flat Elliott wave structure where Minute wave ((a)) ended at 111.48 and Minute wave ((b)) ended at 110.077. Minute wave ((c)) of B ideally ends at 111.29 – 111.65 area or 1.236 – 1.618 extension of Minute ((a)) and ((b)) and from the area, pair should then either resume to a new low or at least pullback in 3 waves. However, due to the nature of an expanded Flat structure, wave C of a Flat can extend even beyond 1.618 extension. In other words, cycle from 3/27 low ideally ends at 111.29 – 111.65, but can also extend a bit higher and still considered to be part of the same Flat structure starting from 3/27 low. The more important invalidation level therefore is the pivot at 3/10 high (115.53) and wave B bounce should unfold in 3, 7, or 11 swing and the bounce is expected to stay below 115.53 for the next extension to the downside. We don’t like buying the pair.
1 Hour USD/JPY Elliott Wave Chart


