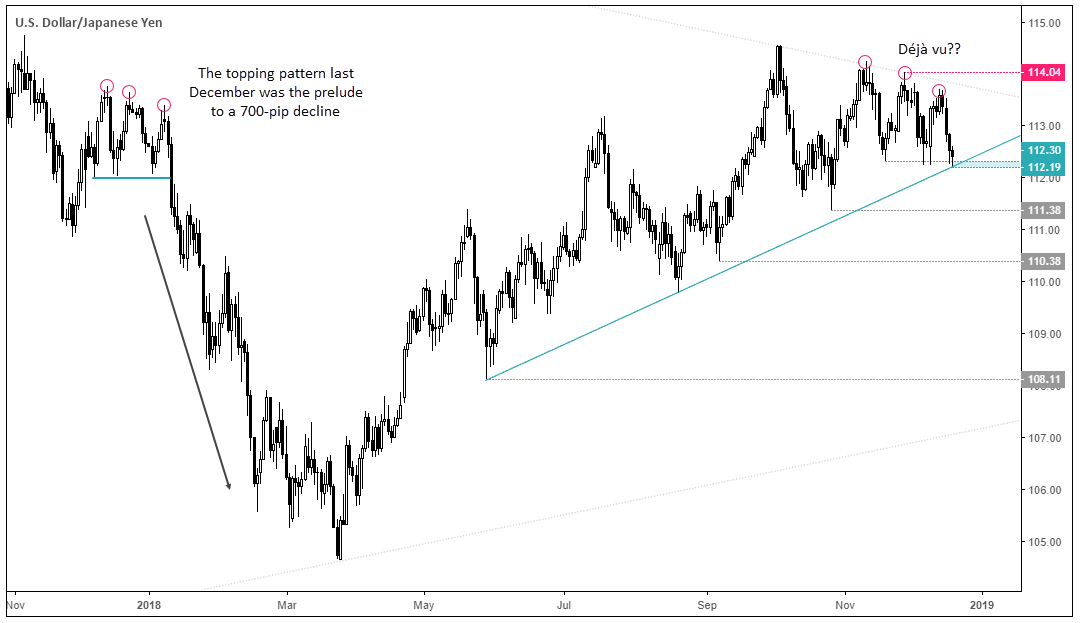
We see a potential topping pattern on USD/JPY which is eerily similar to one last December which resulted in a 700-pip decline. So, with a highly anticipated FOMC meeting just hours away, it’s worth keeping an eye on which way this one breaks.
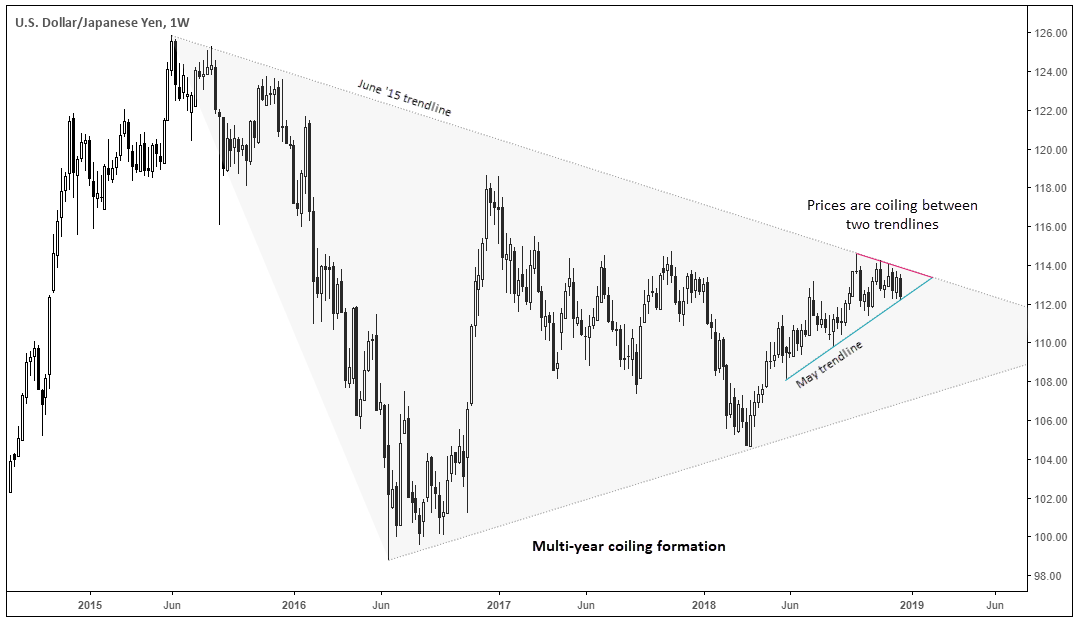
The weekly chart shows that USD/JPY bulls are struggling to overcome the June 2015 trendline, which could be part of a multi-year pattern. We highlighted in a recent video that volatility is brewing within larger coiling formations and continue to think this is the case. If USD/PY is within the process of topping out, the larger triangle leaves potential for a 4% decline without breaking out of it. And, whilst this may be too large a timeframe to trade for most, it provides a starting point before drilling down to the lower timeframes.

We can see on the daily chart that the pair is caught between the May 2018 and June 2015 trendlines. Whilst the daily trend itself could assume an eventual break higher, the three lower highs (or peaks) above horizontal support suggests a topping pattern could be in play. Moreover, we note how an eerily similar price formation in December 2017 led to a 700+ pip decline.

A break below 112 would clear the May trendline and suggest the top is confirmed. Yet it would need to happen quickly if it wants to track its predecessor lower, as a bounce higher from support would alter the pattern. We fully expect today’s FOMC meeting to leave its mark on this chart today and, if Powell bows to the pressure of Trump, market volatility and growth concerns, we could find USD/JPY comfortably below 112 tomorrow.
