🧐 ProPicks AI October update is out now! See which stocks made the listPick Stocks with AI

USD/CNH Looks Bearish In The Midst Of Trade War

Published 07/04/2019, 05:18 AM
Updated 07/09/2023, 06:31 AM
USD/CNH
-

Less than a month ago USD/CNH rose to 6.9621 and it looked like reaching a new multi-year high above 7.0000 was only a matter of time. Unfortunately for the bulls, the market chose otherwise.

USD/CNH fell to 6.8164 on the last day of June. As of this writing, the pair is hovering around 6.8755 following recovery to 6.9003 yesterday. In order to see what can be expected from now on, let’s take a look at the recent weakness through the prism of the Elliott Wave principle.
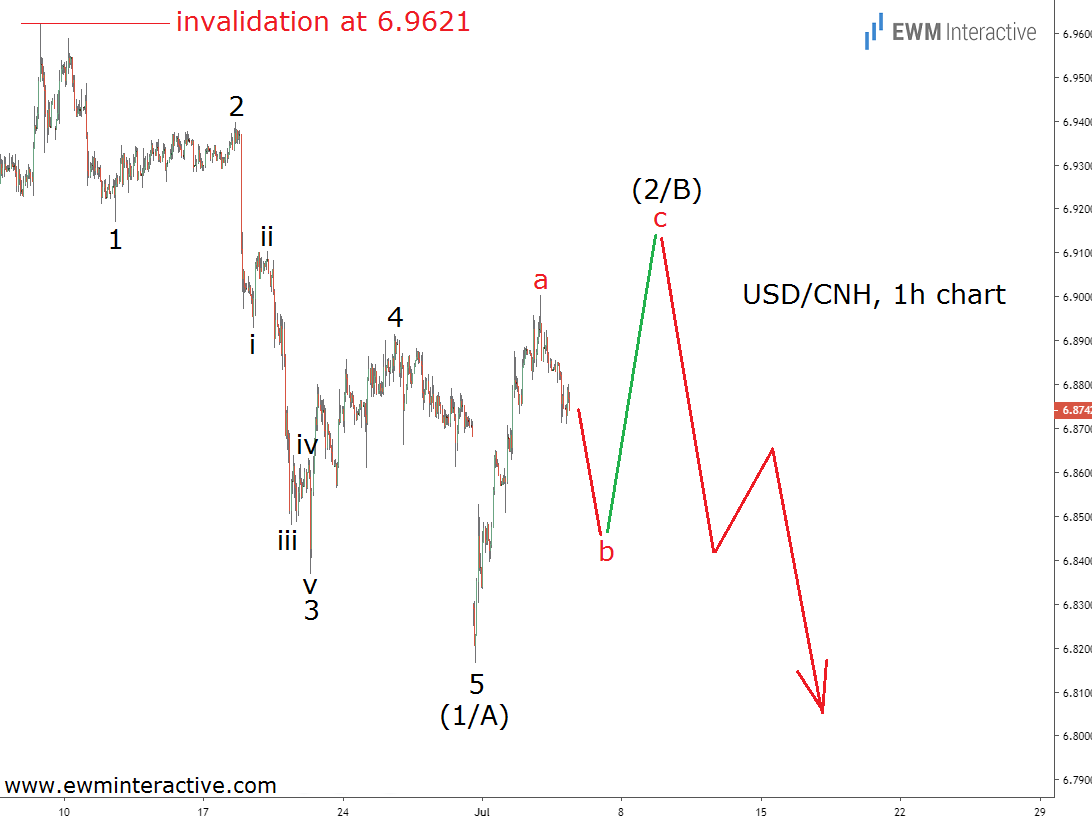
USDCNH 1 Hour Chart

The hourly chart of USD/CNH reveals that the drop from 6.9621 to 6.8164 is actually a clear five-wave impulse pattern. It is labeled 1-2-3-4-5 in wave (1/A), where the sub-waves of wave 3 are also visible.

This tells us two things: one, the recovery to 6.9003 must be part of the corresponding three-wave correction in wave (2/B); and two, once wave (2/B) is over, more weakness in wave (3/C) should be anticipated. The level beyond which this count will no longer be valid is the starting point of wave (1/A) at 6.9621.

The odds remain in the bears’ favor as long as USD/CNH trades below this key level. Since wave (3/C) is supposed to exceed the bottom of wave (1/A), targets below 6.8164 make sense.

Original Post

Latest comments

Loading next article…
Risk Disclosure: Trading in financial instruments and/or cryptocurrencies involves high risks including the risk of losing some, or all, of your investment amount, and may not be suitable for all investors. Prices of cryptocurrencies are extremely volatile and may be affected by external factors such as financial, regulatory or political events. Trading on margin increases the financial risks.
Before deciding to trade in financial instrument or cryptocurrencies you should be fully informed of the risks and costs associated with trading the financial markets, carefully consider your investment objectives, level of experience, and risk appetite, and seek professional advice where needed.
Fusion Media would like to remind you that the data contained in this website is not necessarily real-time nor accurate. The data and prices on the website are not necessarily provided by any market or exchange, but may be provided by market makers, and so prices may not be accurate and may differ from the actual price at any given market, meaning prices are indicative and not appropriate for trading purposes. Fusion Media and any provider of the data contained in this website will not accept liability for any loss or damage as a result of your trading, or your reliance on the information contained within this website.
It is prohibited to use, store, reproduce, display, modify, transmit or distribute the data contained in this website without the explicit prior written permission of Fusion Media and/or the data provider. All intellectual property rights are reserved by the providers and/or the exchange providing the data contained in this website.
Fusion Media may be compensated by the advertisers that appear on the website, based on your interaction with the advertisements or advertisers.
© 2007-2024 - Fusion Media Limited. All Rights Reserved.