USD/CHF traded higher on Monday, emerged temporarily above the high of last Wednesday, at 0.9273, but pulled back below it. Overall, the pair continues to trade above the upside support line drawn from the low of Aug. 4, and therefore, we would consider the near-term outlook to still be positive, even if the current setback continues for a while more.
If indeed we see some further retreat, the bulls may decide to jump back into the action from near the 0.9220 territory, which acted as a temporary floor between Sept. 21 and 24, or from near the aforementioned upside line. This time, the rebound may result in a permanent break above 0.9273, which could encourage advances towards the 0.9332 barrier, marked by the high of Sept. 20. If the bulls are not willing to stop there either, then we could see the trend extending towards the 0.9305 territory, defined as a resistance by the peak of Apr. 6.
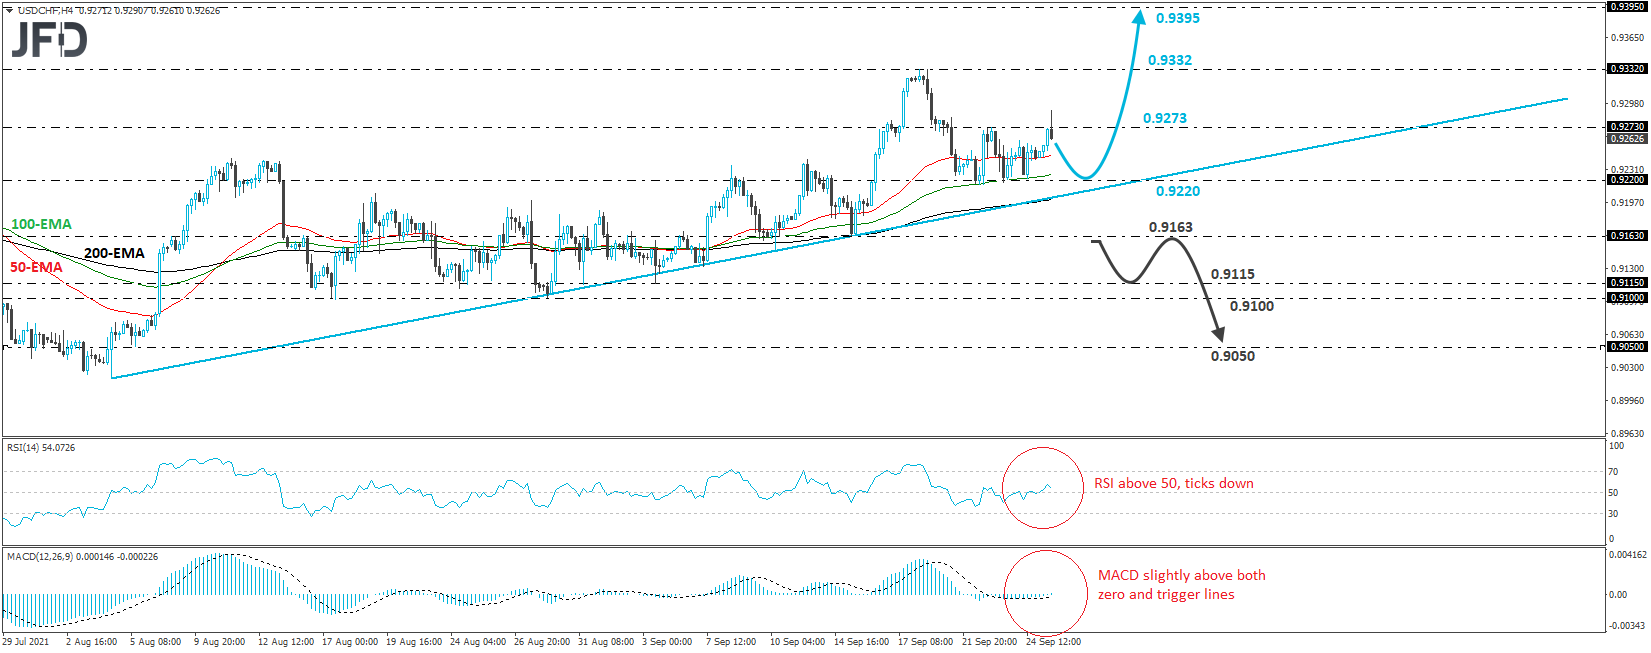
Shifting attention to our short-term oscillators, we see that the RSI moved back above 50, but just ticked down, while the MACD lies slightly above both its zero and trigger lines. Both indicators suggest that the rate may have started gathering upside speed, which supports a trend continuation, but the fact that the RSI ticked down make us careful over a possible further retreat before the next leg north.
Now, in order to start examining the case of a bearish reversal, we would like to see a dip below 0.9163, marked by the low of Sept. 15. The pair will already be below the upside line taken from the low of Aug. 4, and the bears may decide to dive towards the 0.9115 or 0.9100 zones, marked by the lows of Sept. 3 and Aug. 30 respectively. If neither support is able to stop the decline, then a break lower may see scope for extensions towards the 0.9050 area, near the low of Aug. 5.