If you follow our articles you probably noticed that we are mostly trend followers and we use price action techniques totally ignoring all the indicators. 99% of the time that is the situation but sometimes my eye can spot an interesting occasion, which is a counter-trend and in the same time is using a divergence in one of the most popular indicators - MACD.
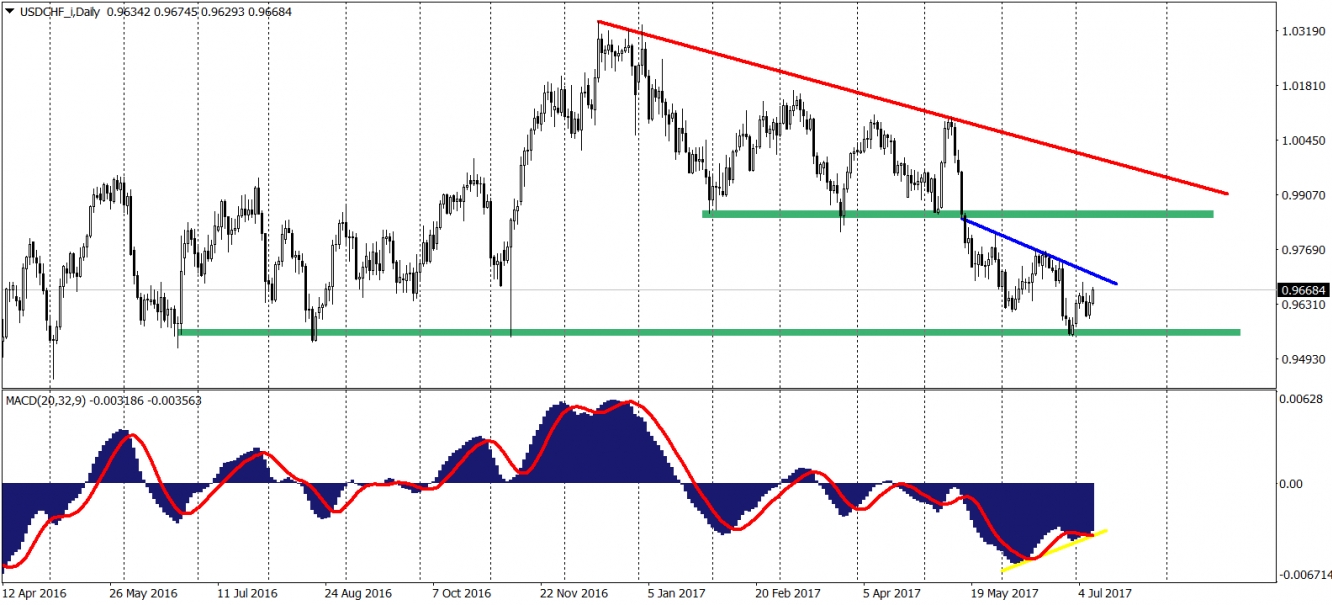
Today's analysis is focused on the USD/CHF, where the long-term trend is negative but our view on this instrument is optimistic. Do not get me wrong, there is no buy signal yet but it looks like it can be created soon. So, the price just bounced from the yearly lows (0.956). That is a strong support as was active in the June, August and November 2017. Bounce looks legitimate as we do have a divergence with the MACD here - the price is making lower lows but the indicator is not. Isn't that a signal to open a long position? For the patient traders – No. What we are missing here is a breakout of the short-term down trendline (blue). Once this will happen – buy signal will emerge.
The closest resistance for this movement is on 0.9860 (upper green). The positive sentiment will be definitely wiped out once the price will make new yearly lows but in this technical situation, chances for that are limited.

