USD/CHF Caught Between A Rock And A Hard Place

Published 04/19/2018, 07:43 AM

Since the February low, USD/CHF has been grinding higher in a rather unsatisfying way. Yet if we are to clear the next technical hurdle nearby, it could open-up the playing field for momentum traders to embrace.

We can see on the daily chart that, whilst in a bullish trend, it has at times been a little choppy. This has largely kept it off-of our watchlist as we prefer to see minor retracements interconnected with clear phases of range expansion. Still, it’s climbed to a 3-month high and Tuesday’s range expansion session closed above its 200-day average for the first time since January. Perhaps things are starting to look up (no pun intended).
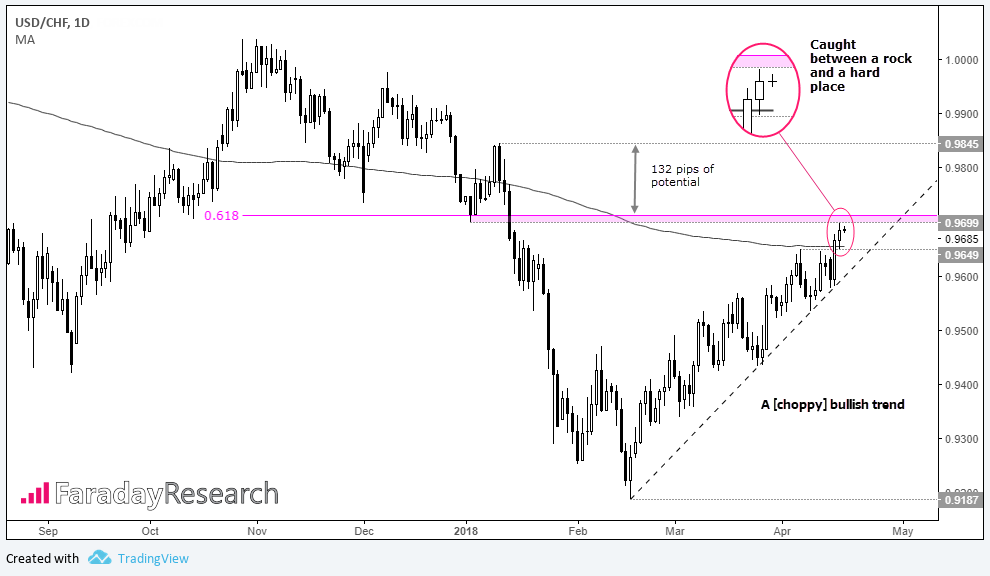
USD/CHF 1-Day Chart

However, there’s a clear zone of resistance nearby which could supress the rally once more. Yesterday’s high was halted by the Jan 9th low of 0.9699, and at 0.9713 sits the 61.8% Fibonacci retracement. Add into the mix the 50-week average at 0.9690 (not pictured) and the resistance zone sits between 0.9669/713. With yesterday’s range essentially sandwiched between the 200-day average and the resistance zone, you could say its caught between a rock and a hard place. So, we’d need to see a clear break of 0.9699 at the very least or 0.9713 for added confirmation before considering a long setup. If we can clear the resistance zone it brings the 0.9845 high into focus with a relatively unobstructed view.

Zooming into the four-hour chart the bullish trend is clearer to the eye. We also note a breakout from 0.9760 after printing a prominent higher low, and it’s also encouraging to the bull-camp that it’s since been respected as support.
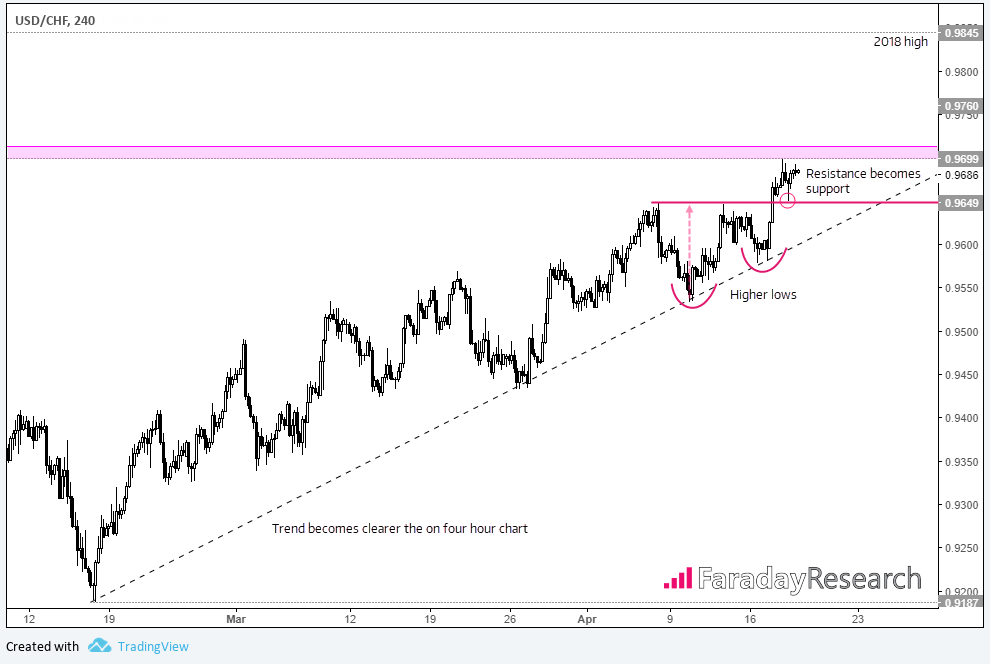
USD/CHF 240 Chart

If bearish momentum returns and resistance holds, there’s not much for us to do other than look elsewhere. But to take that a step further, if we see a clear rejection of resistance and break of the bullish trendline, bears would be likely licking their lips for a short position. But if you prefer to trade with the trend, it’s probably safer to wait for a break above 0.9713 with a view to target the 0.9845 high.

Original post

Latest comments

Loading next article…
Risk Disclosure: Trading in financial instruments and/or cryptocurrencies involves high risks including the risk of losing some, or all, of your investment amount, and may not be suitable for all investors. Prices of cryptocurrencies are extremely volatile and may be affected by external factors such as financial, regulatory or political events. Trading on margin increases the financial risks.
Before deciding to trade in financial instrument or cryptocurrencies you should be fully informed of the risks and costs associated with trading the financial markets, carefully consider your investment objectives, level of experience, and risk appetite, and seek professional advice where needed.
Fusion Media would like to remind you that the data contained in this website is not necessarily real-time nor accurate. The data and prices on the website are not necessarily provided by any market or exchange, but may be provided by market makers, and so prices may not be accurate and may differ from the actual price at any given market, meaning prices are indicative and not appropriate for trading purposes. Fusion Media and any provider of the data contained in this website will not accept liability for any loss or damage as a result of your trading, or your reliance on the information contained within this website.
It is prohibited to use, store, reproduce, display, modify, transmit or distribute the data contained in this website without the explicit prior written permission of Fusion Media and/or the data provider. All intellectual property rights are reserved by the providers and/or the exchange providing the data contained in this website.
Fusion Media may be compensated by the advertisers that appear on the website, based on your interaction with the advertisements or advertisers.
© 2007-2025 - Fusion Media Limited. All Rights Reserved.